何かあれば GitHub のリポジトリに issue を作るか ryukau@gmail.com までお気軽にどうぞ。
Update: 2025-01-07
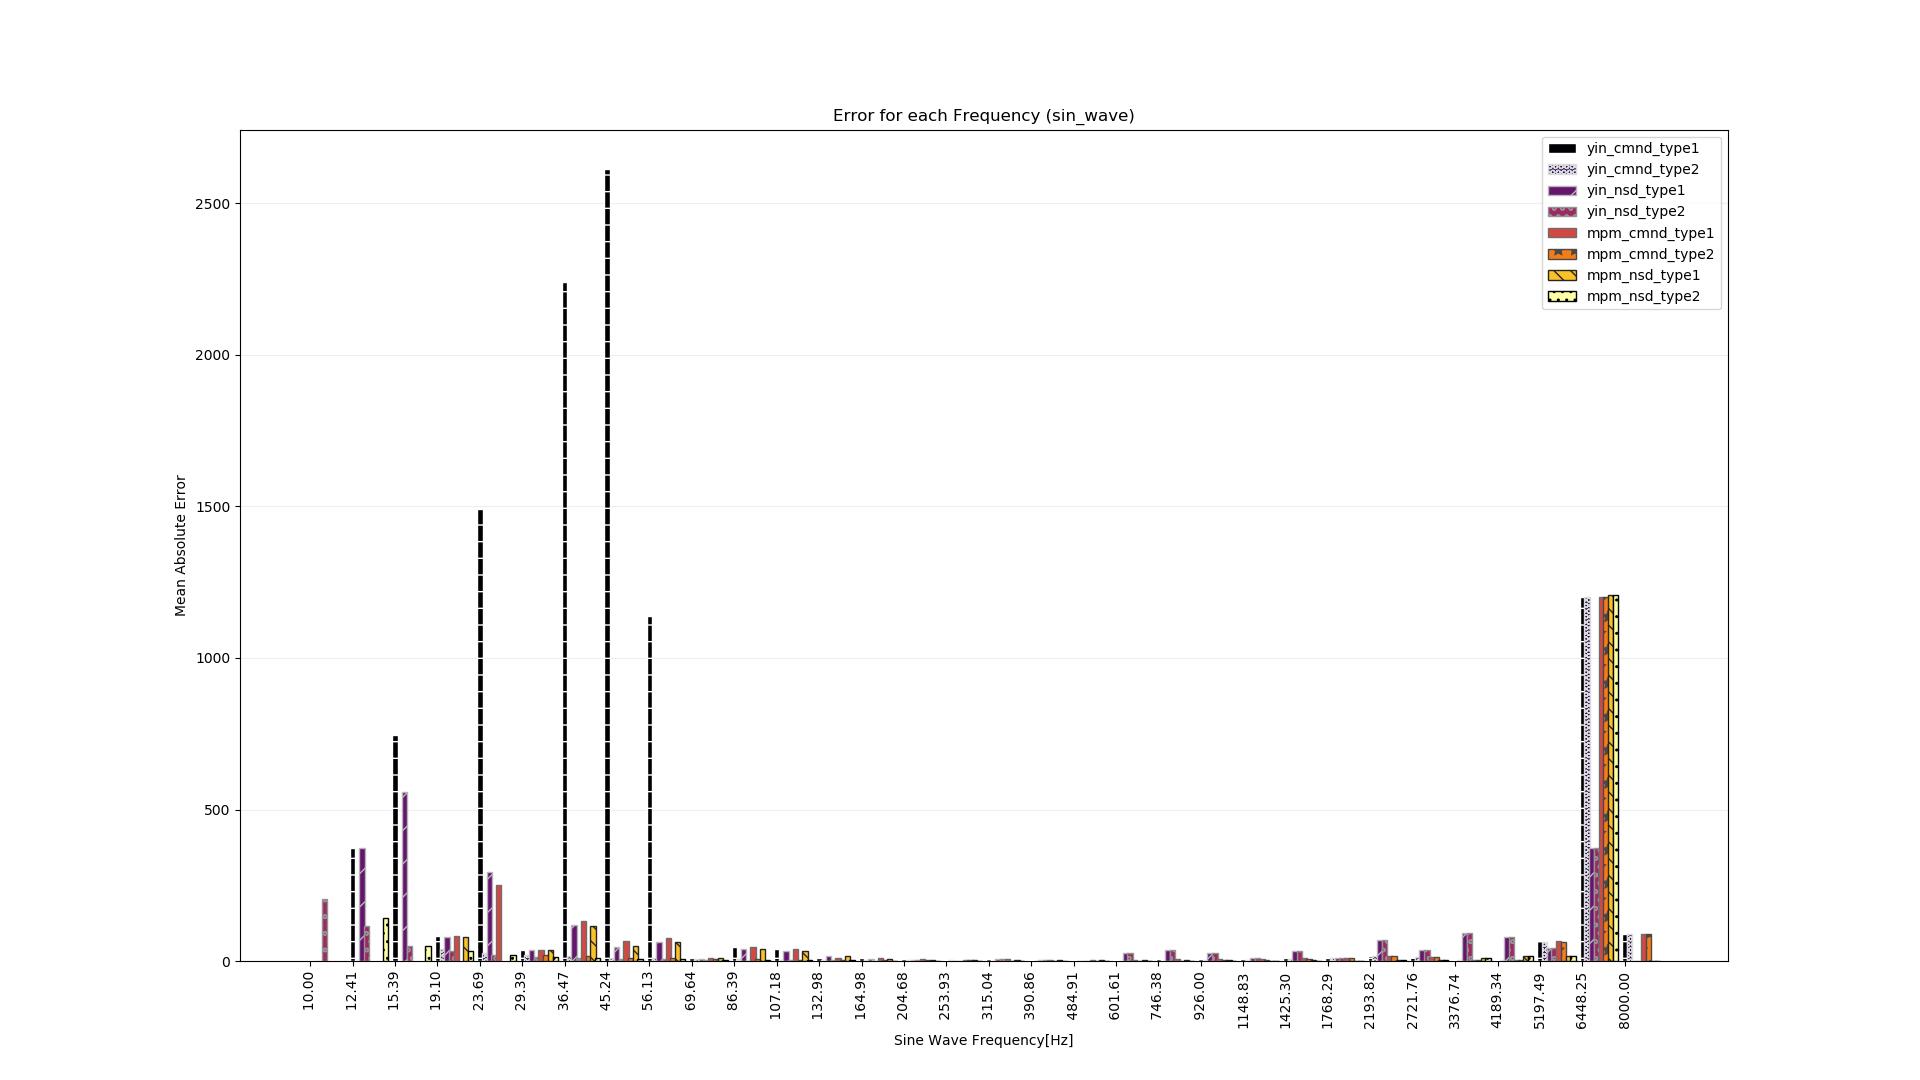
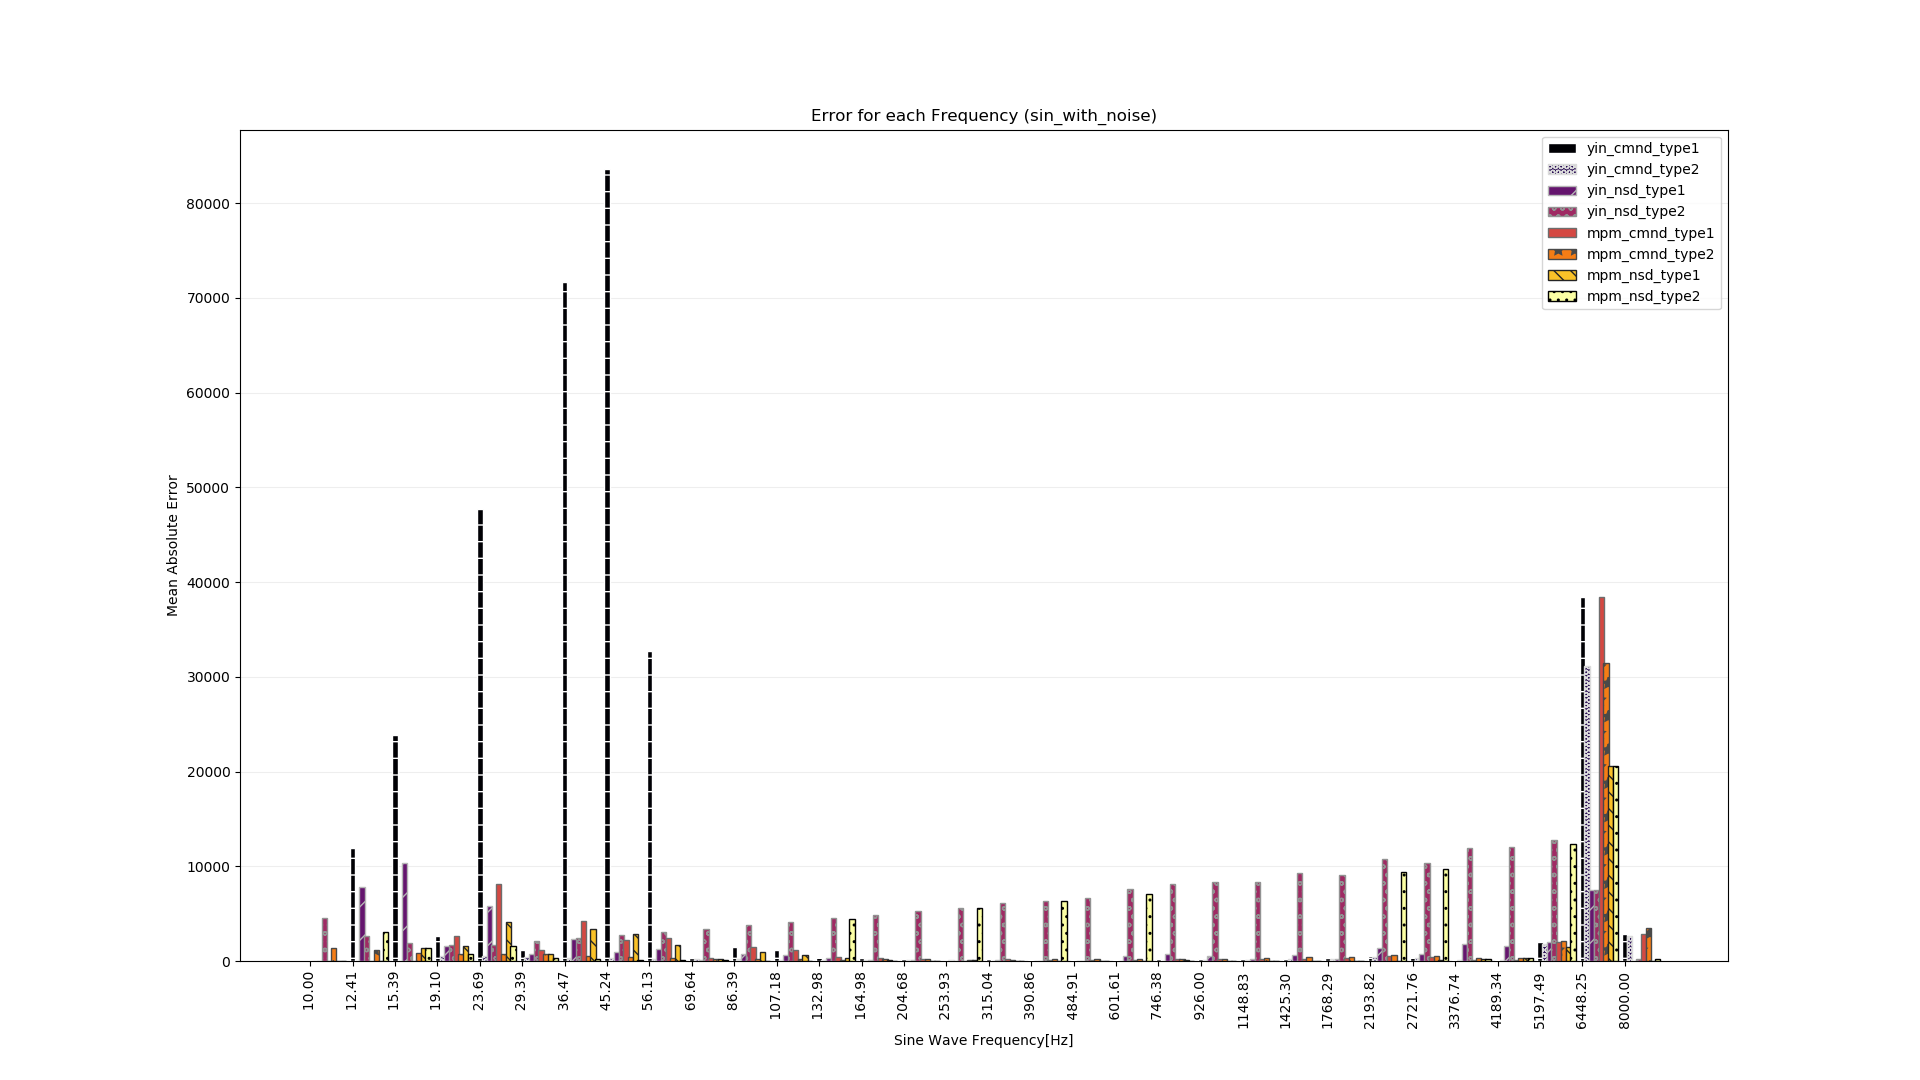
サイン波の周波数ごとの平均絶対誤差です。この形式のグラフの縦軸は対数スケールにしています。
誤差が最大となった YIN-CMND type I は低周波域で大きな誤差が出ています。
6000Hzより上の誤差を除外した場合が気になったのでプロットしました。
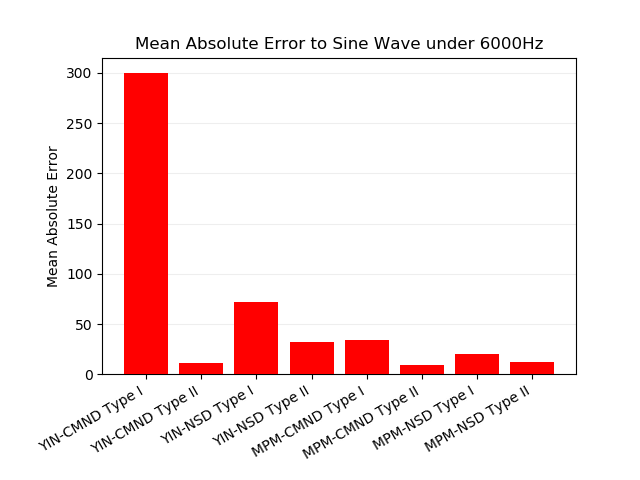
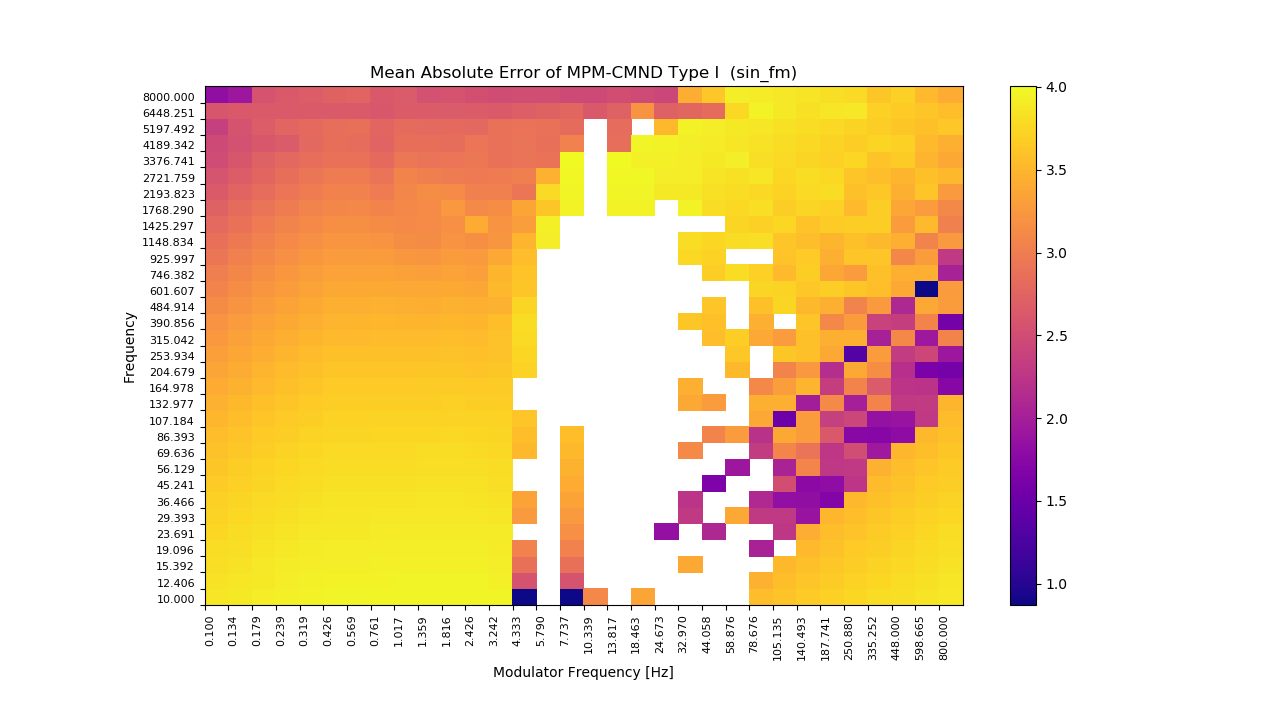
MPM-CMND type II の誤差が最小となりました。サンプリング周波数の3/4よりも高い周波数ではピッチ推定が失敗しやすいのかもしれません。
サイン波の周波数ごとの平均絶対誤差です。
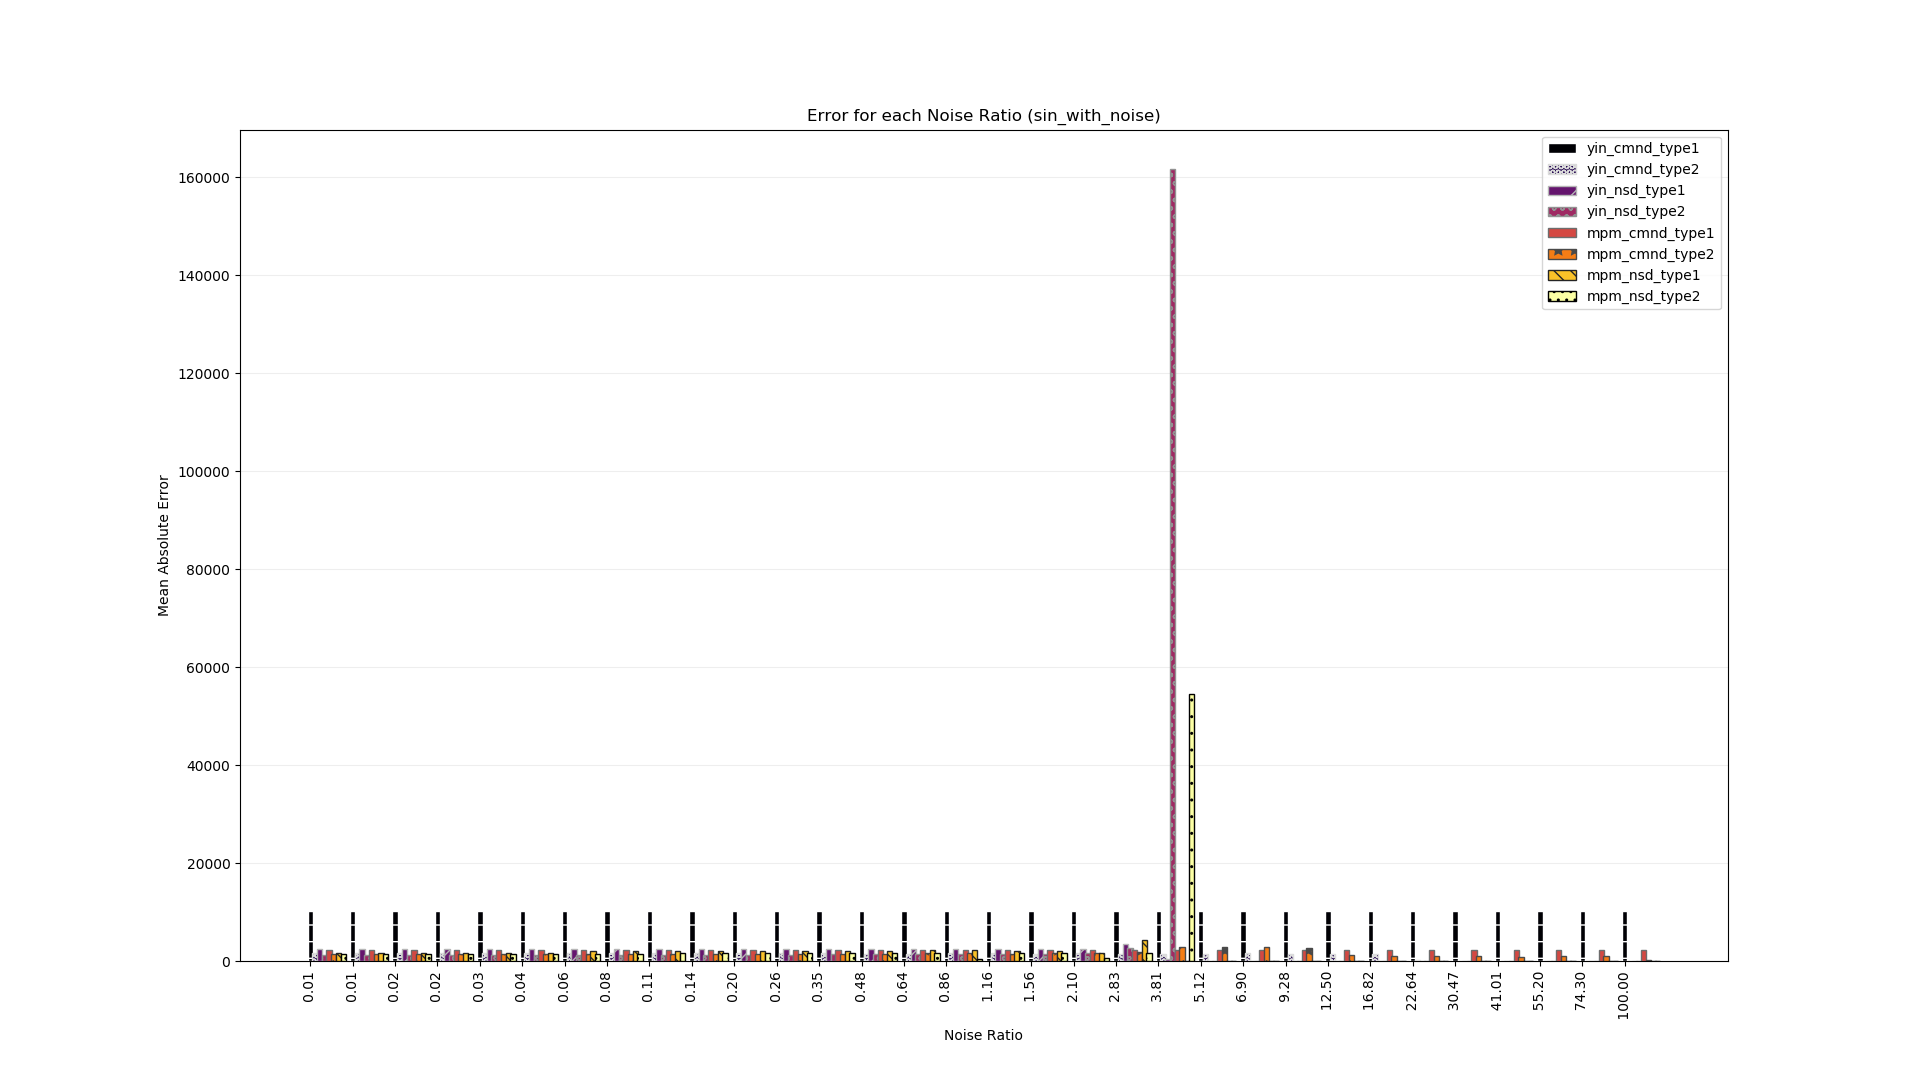
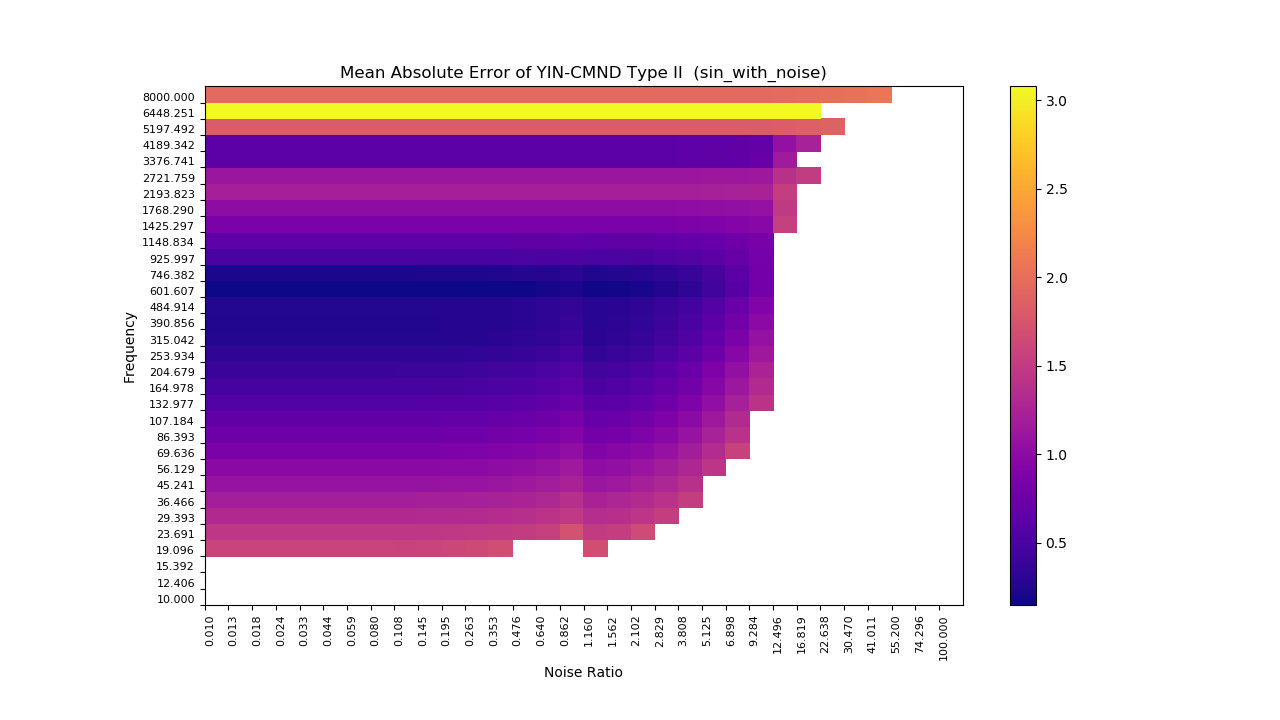
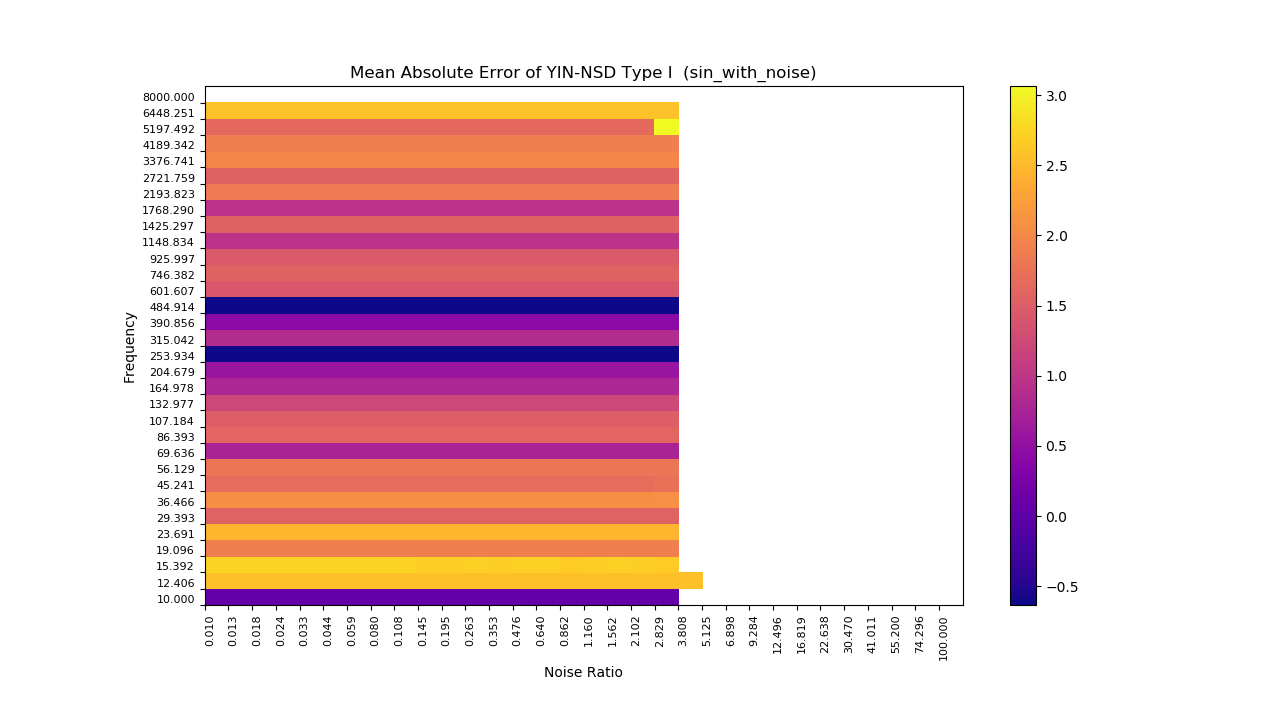
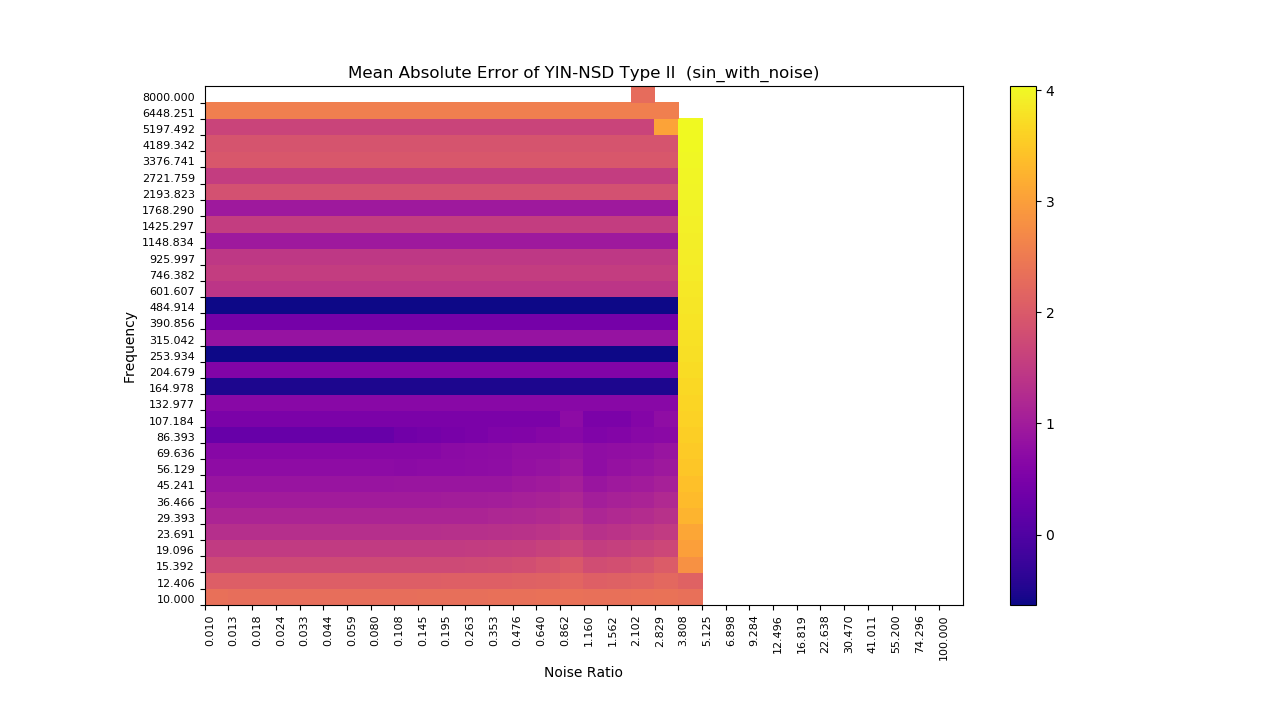
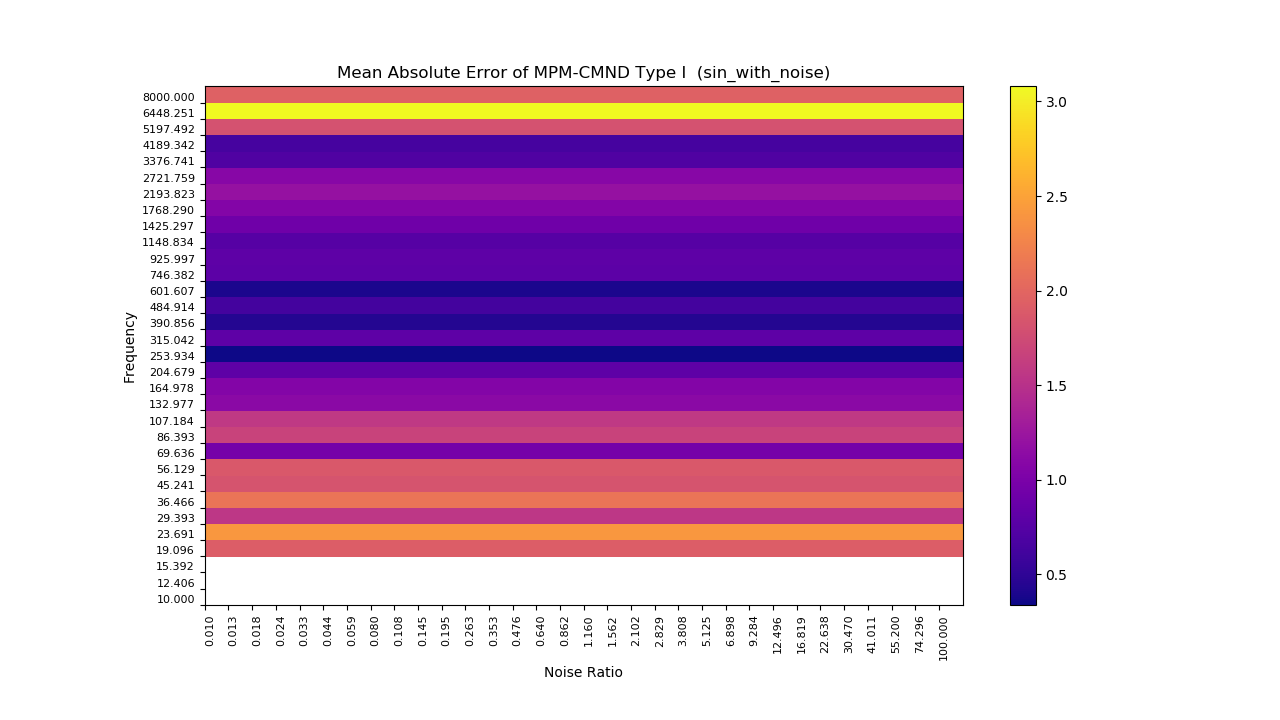
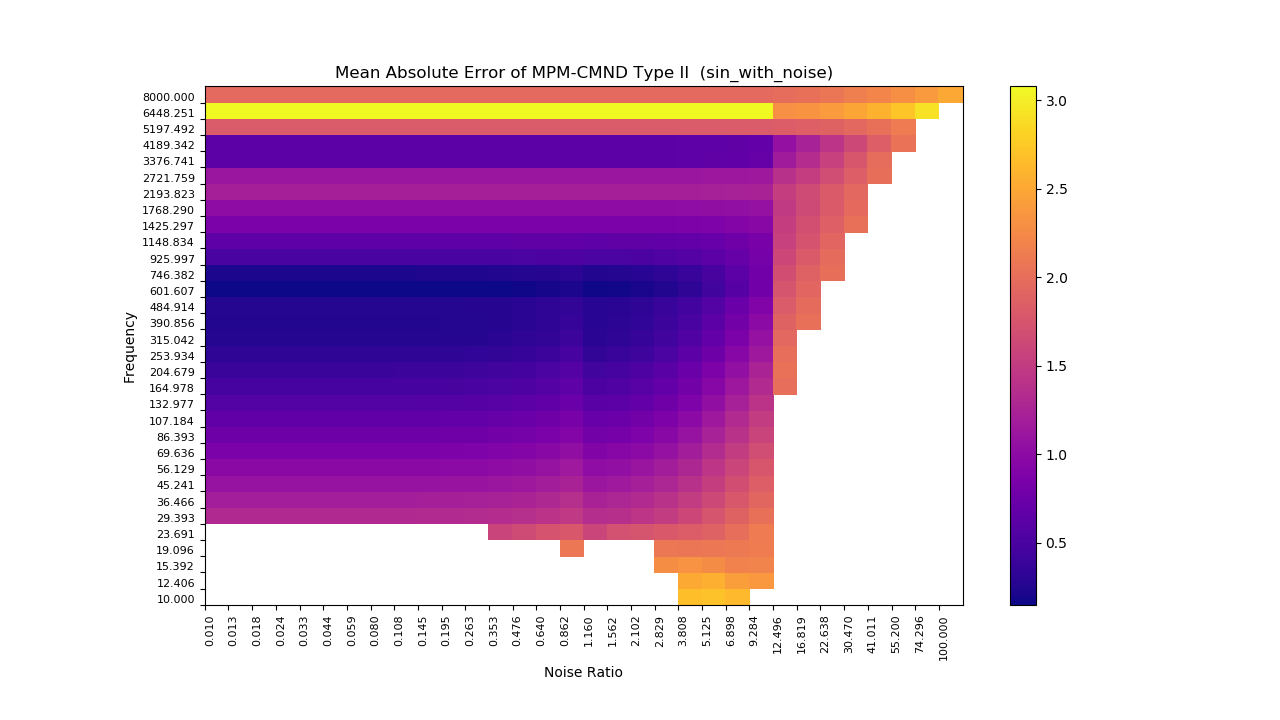
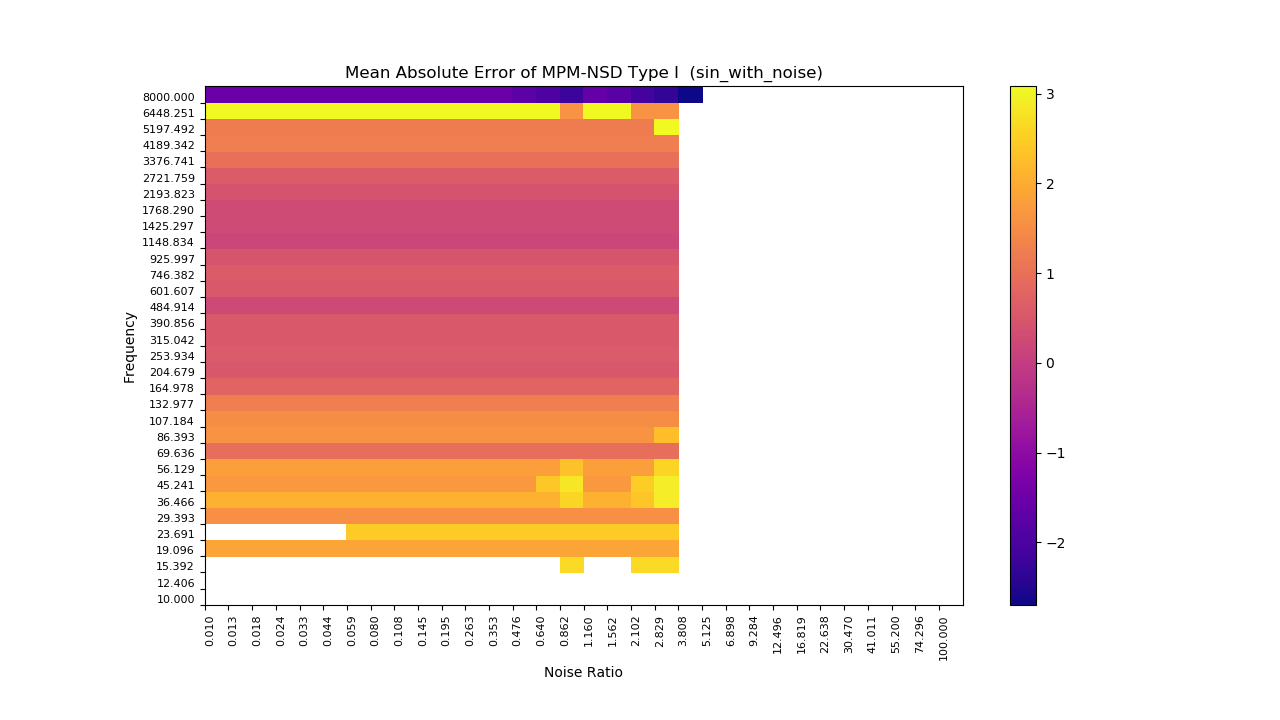
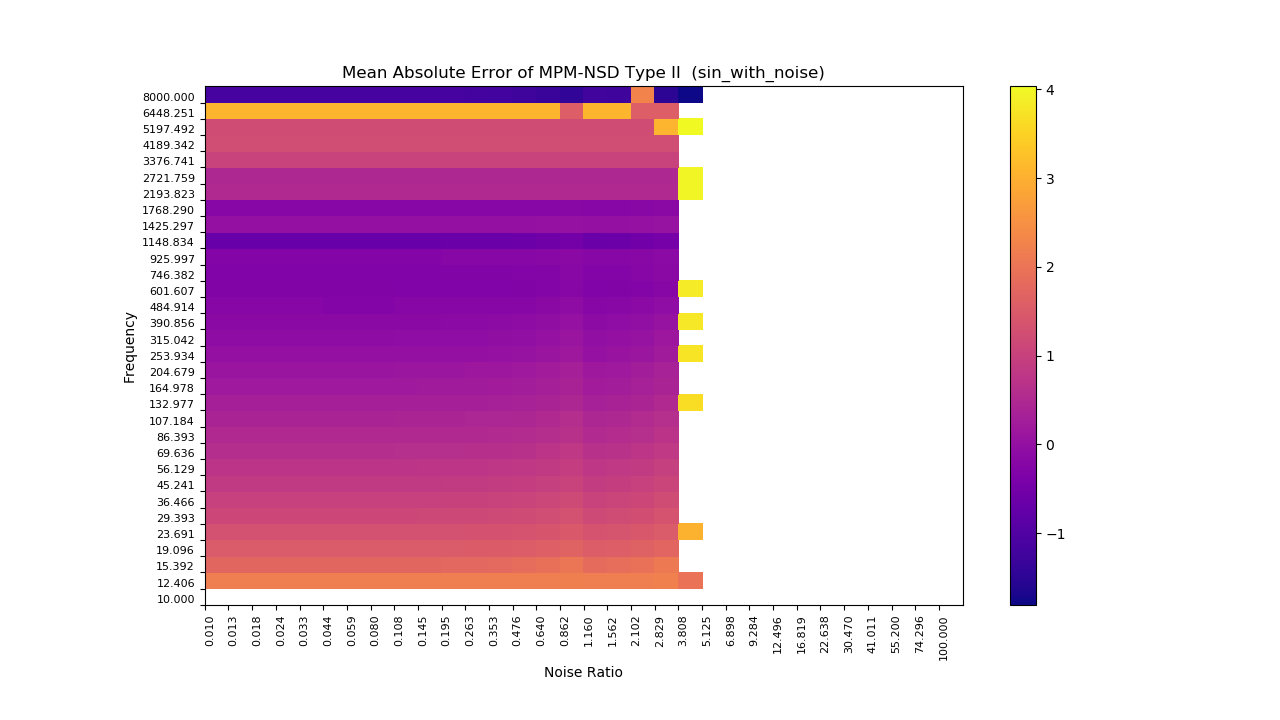
ノイズの比率ごとの平均絶対誤差です。
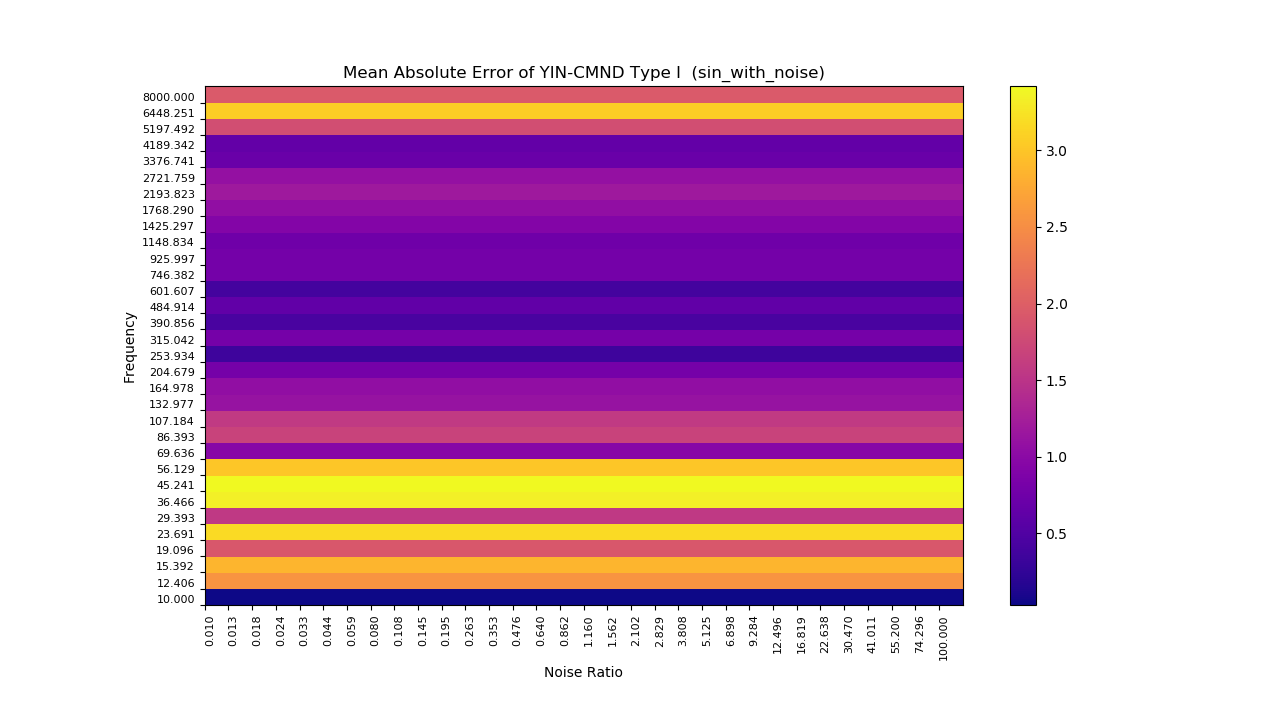
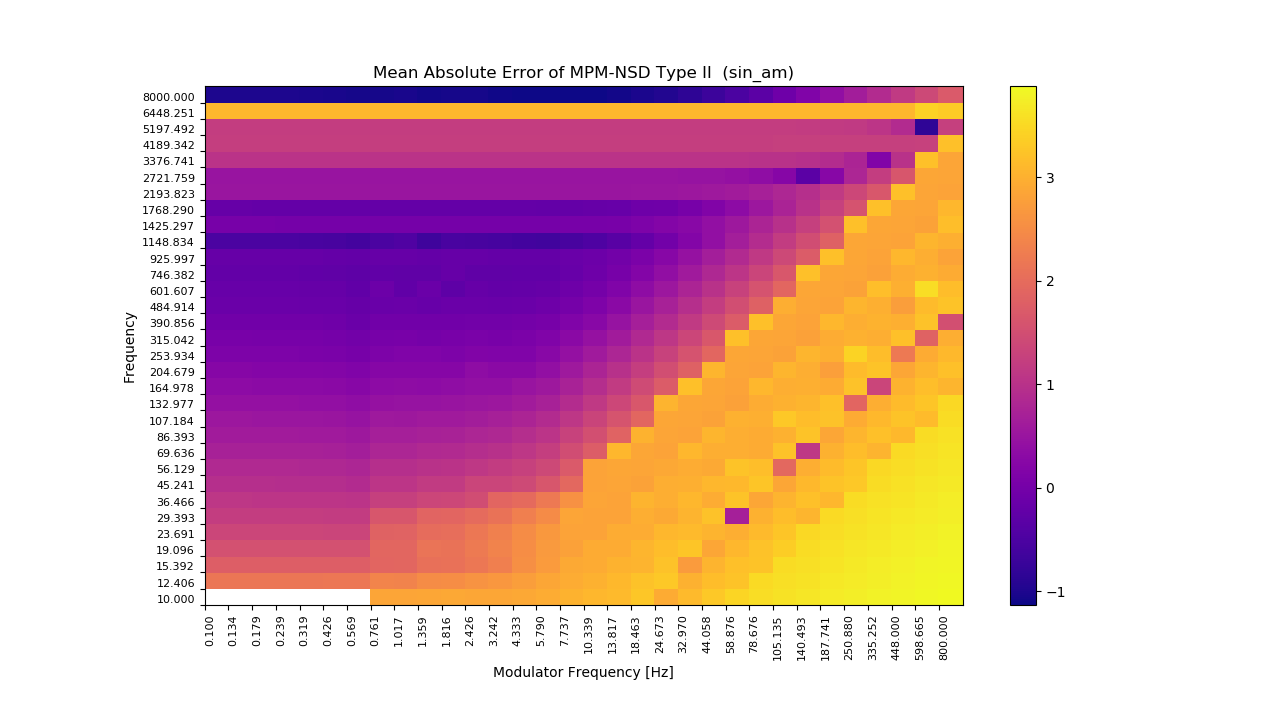
明るいほど誤差が大きく、白い部分は nan
を表しています。グラフの右にあるカラーバーの数字を \(a\) とすると誤差の値は \(10^a\) です。
NSD は信号の大きさ1に対してノイズの大きさが3を超えるとうまく計算できないようです。
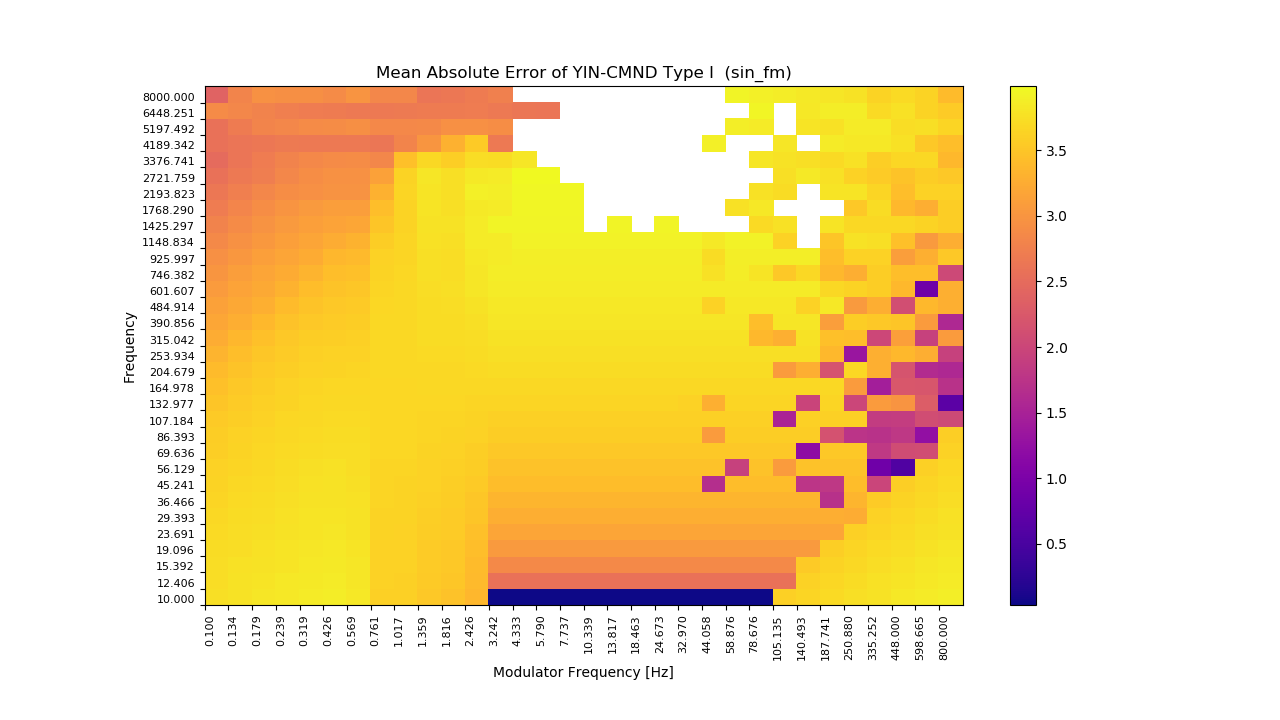
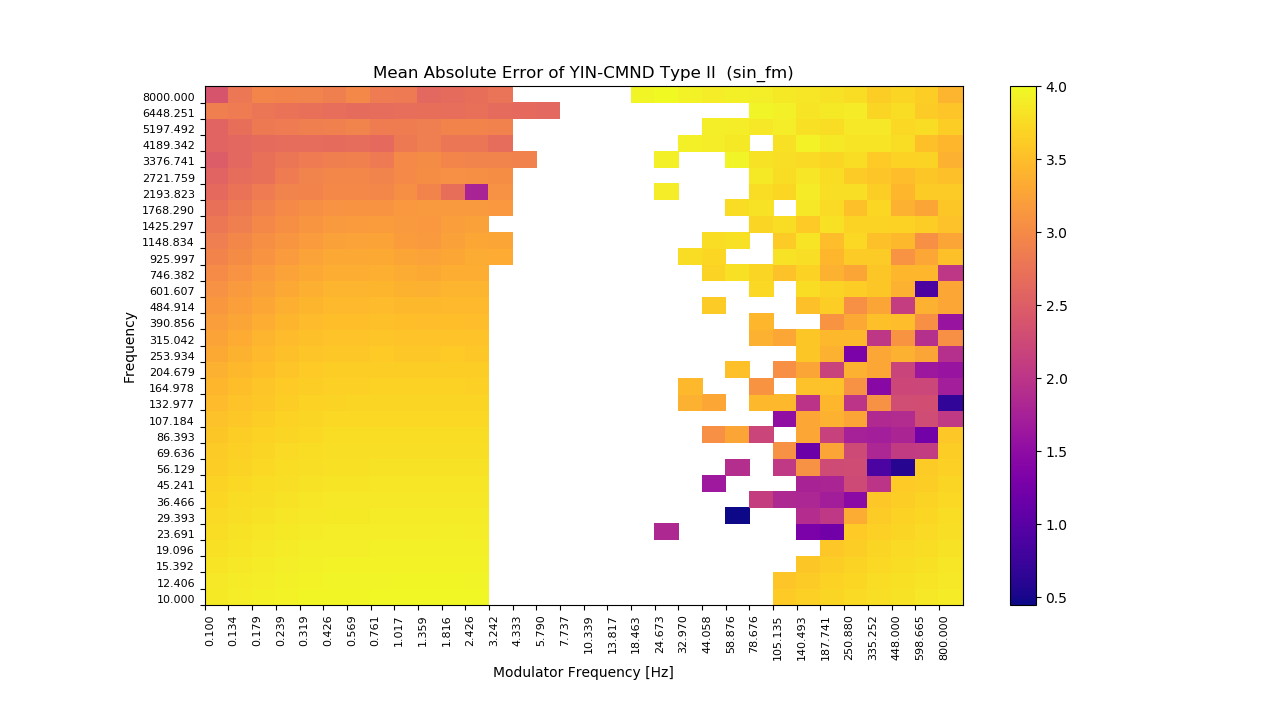
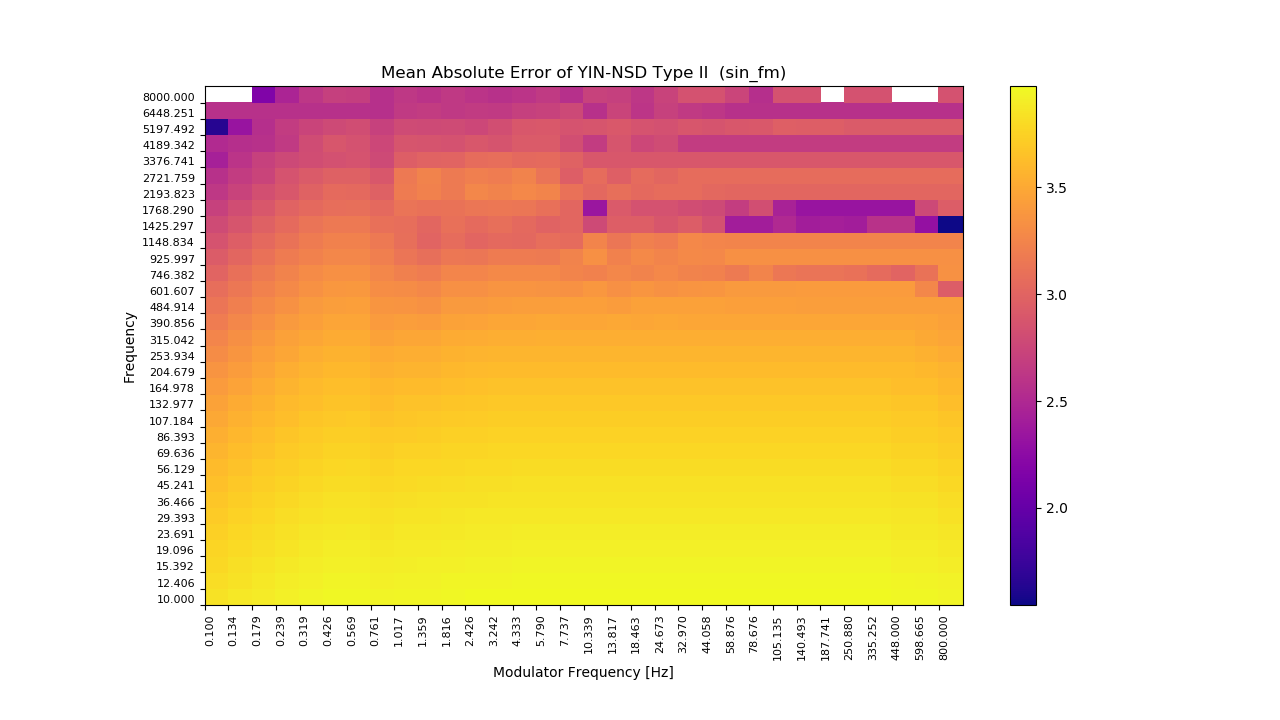
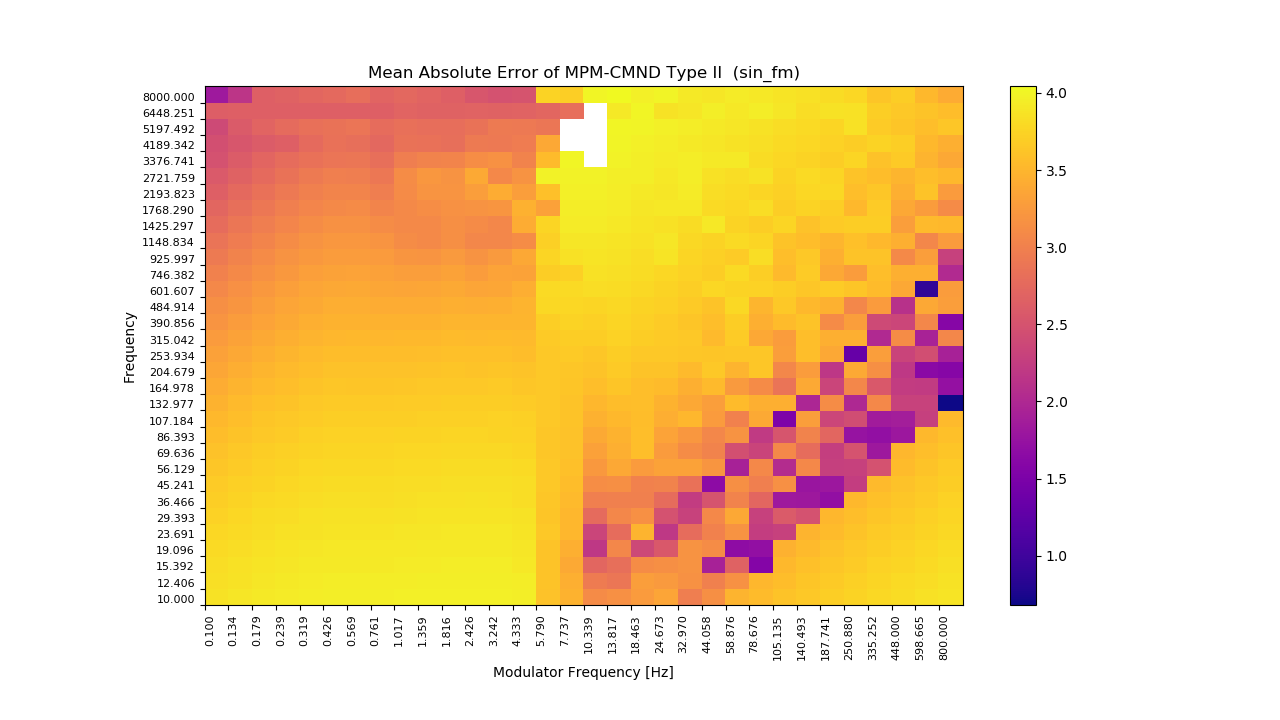
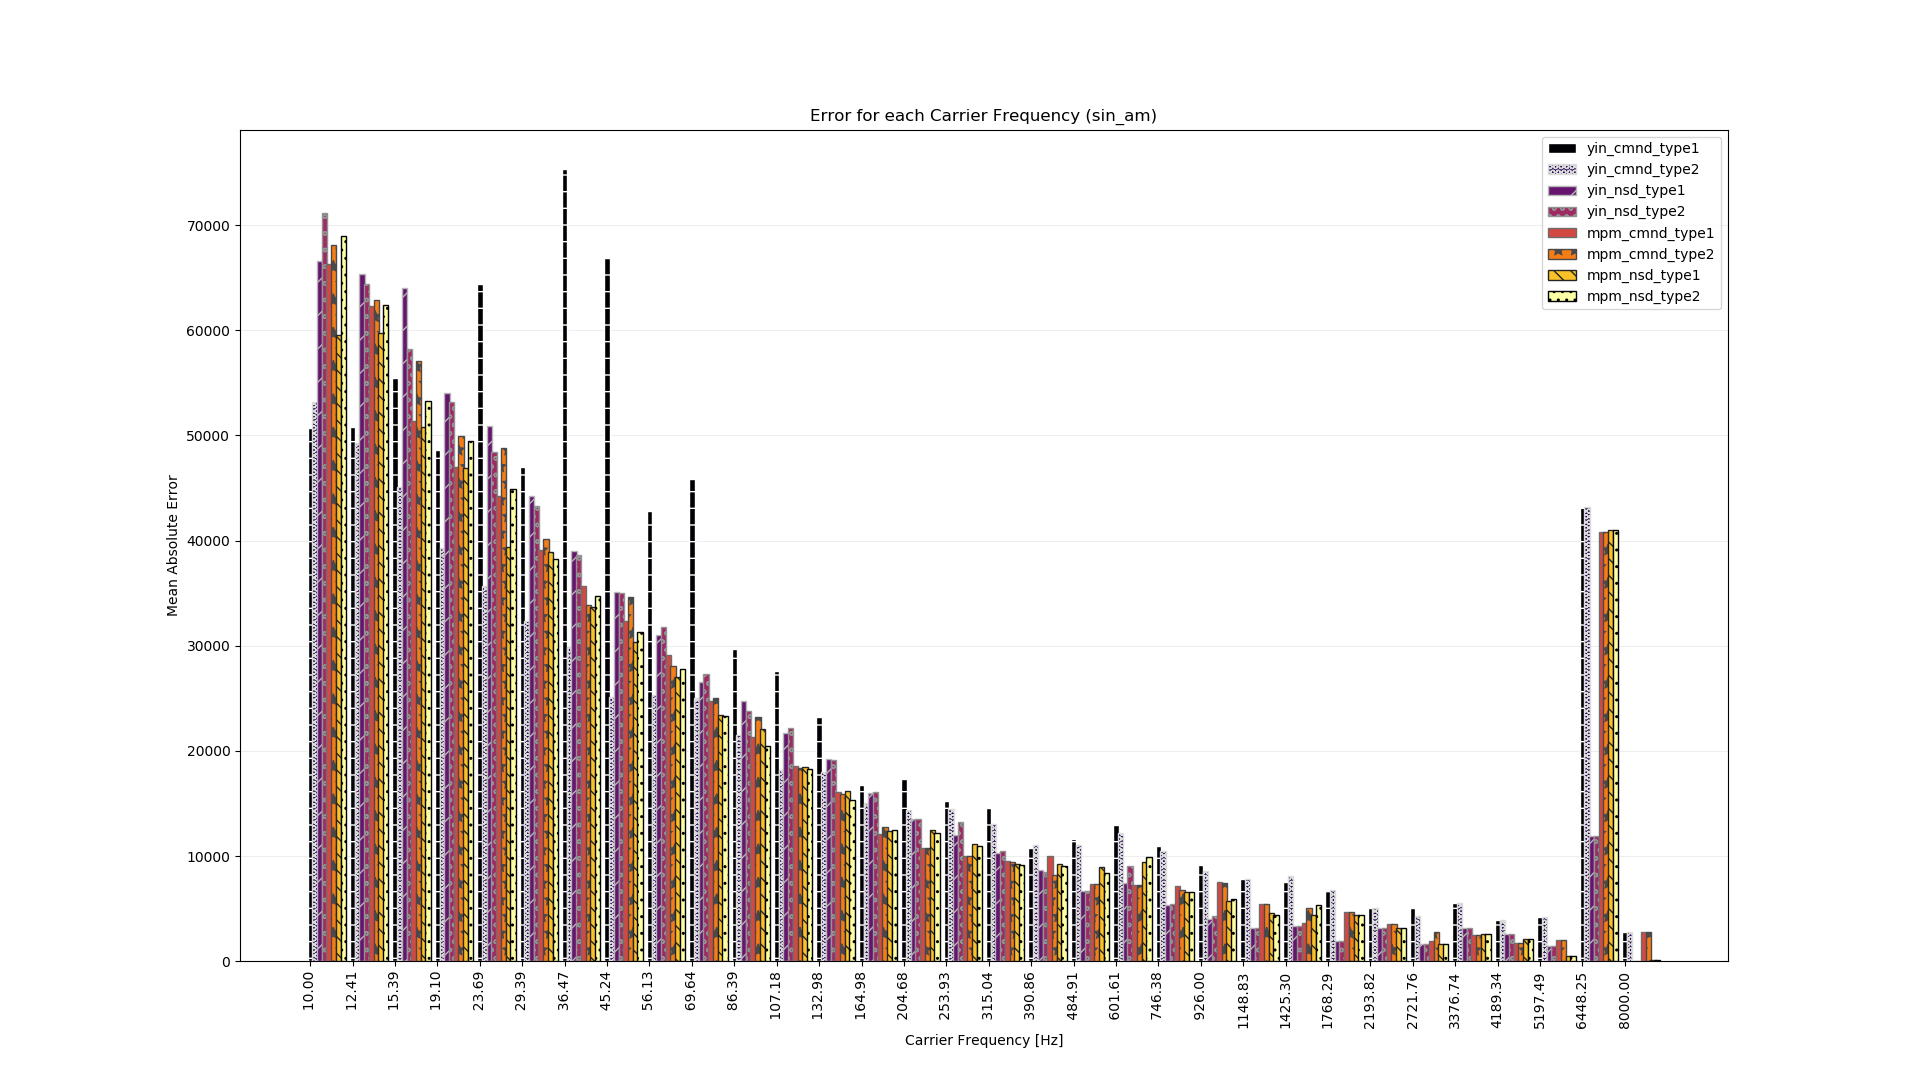
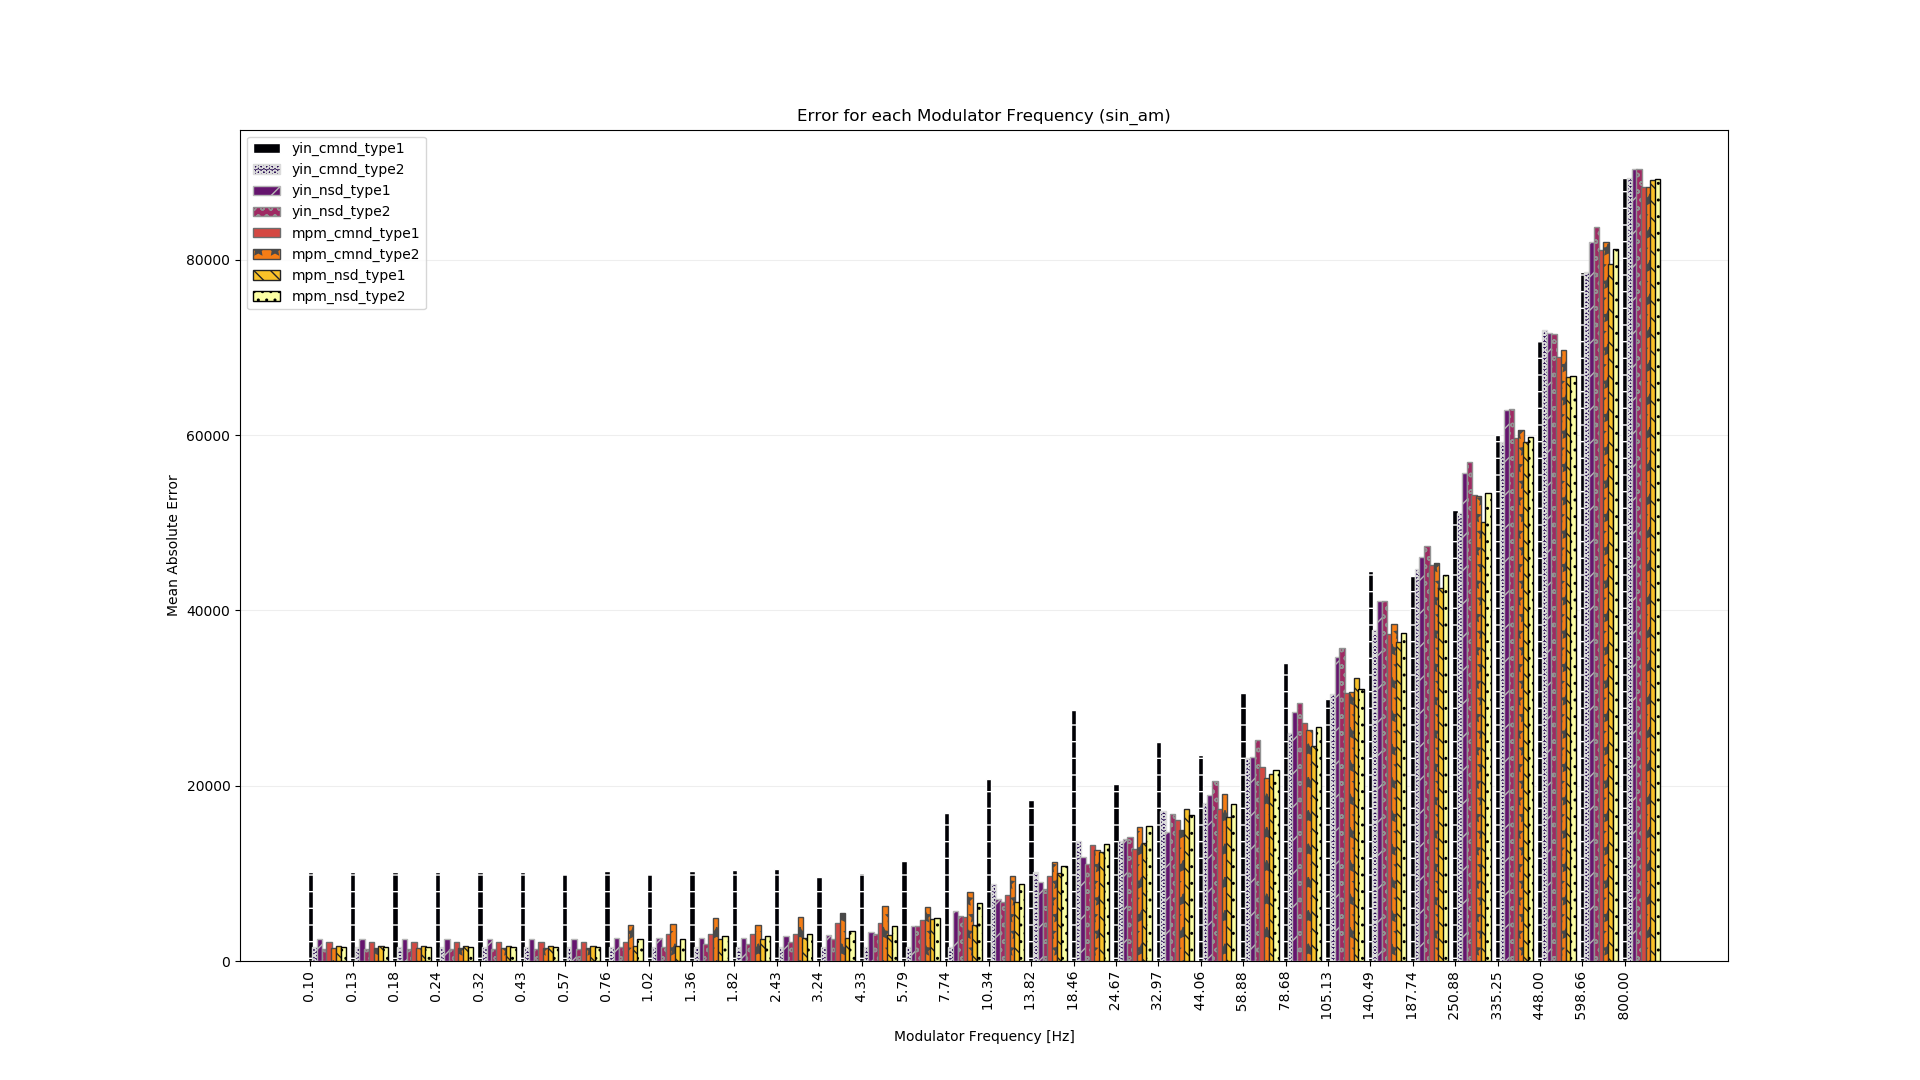
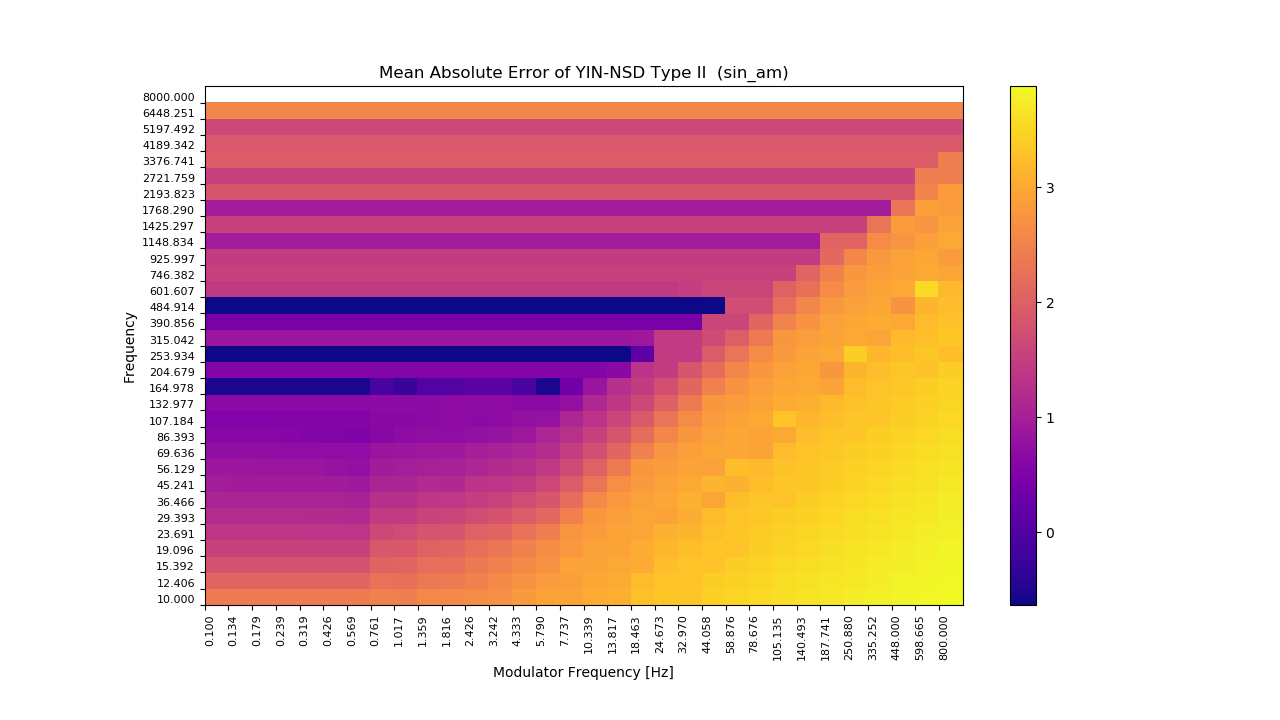
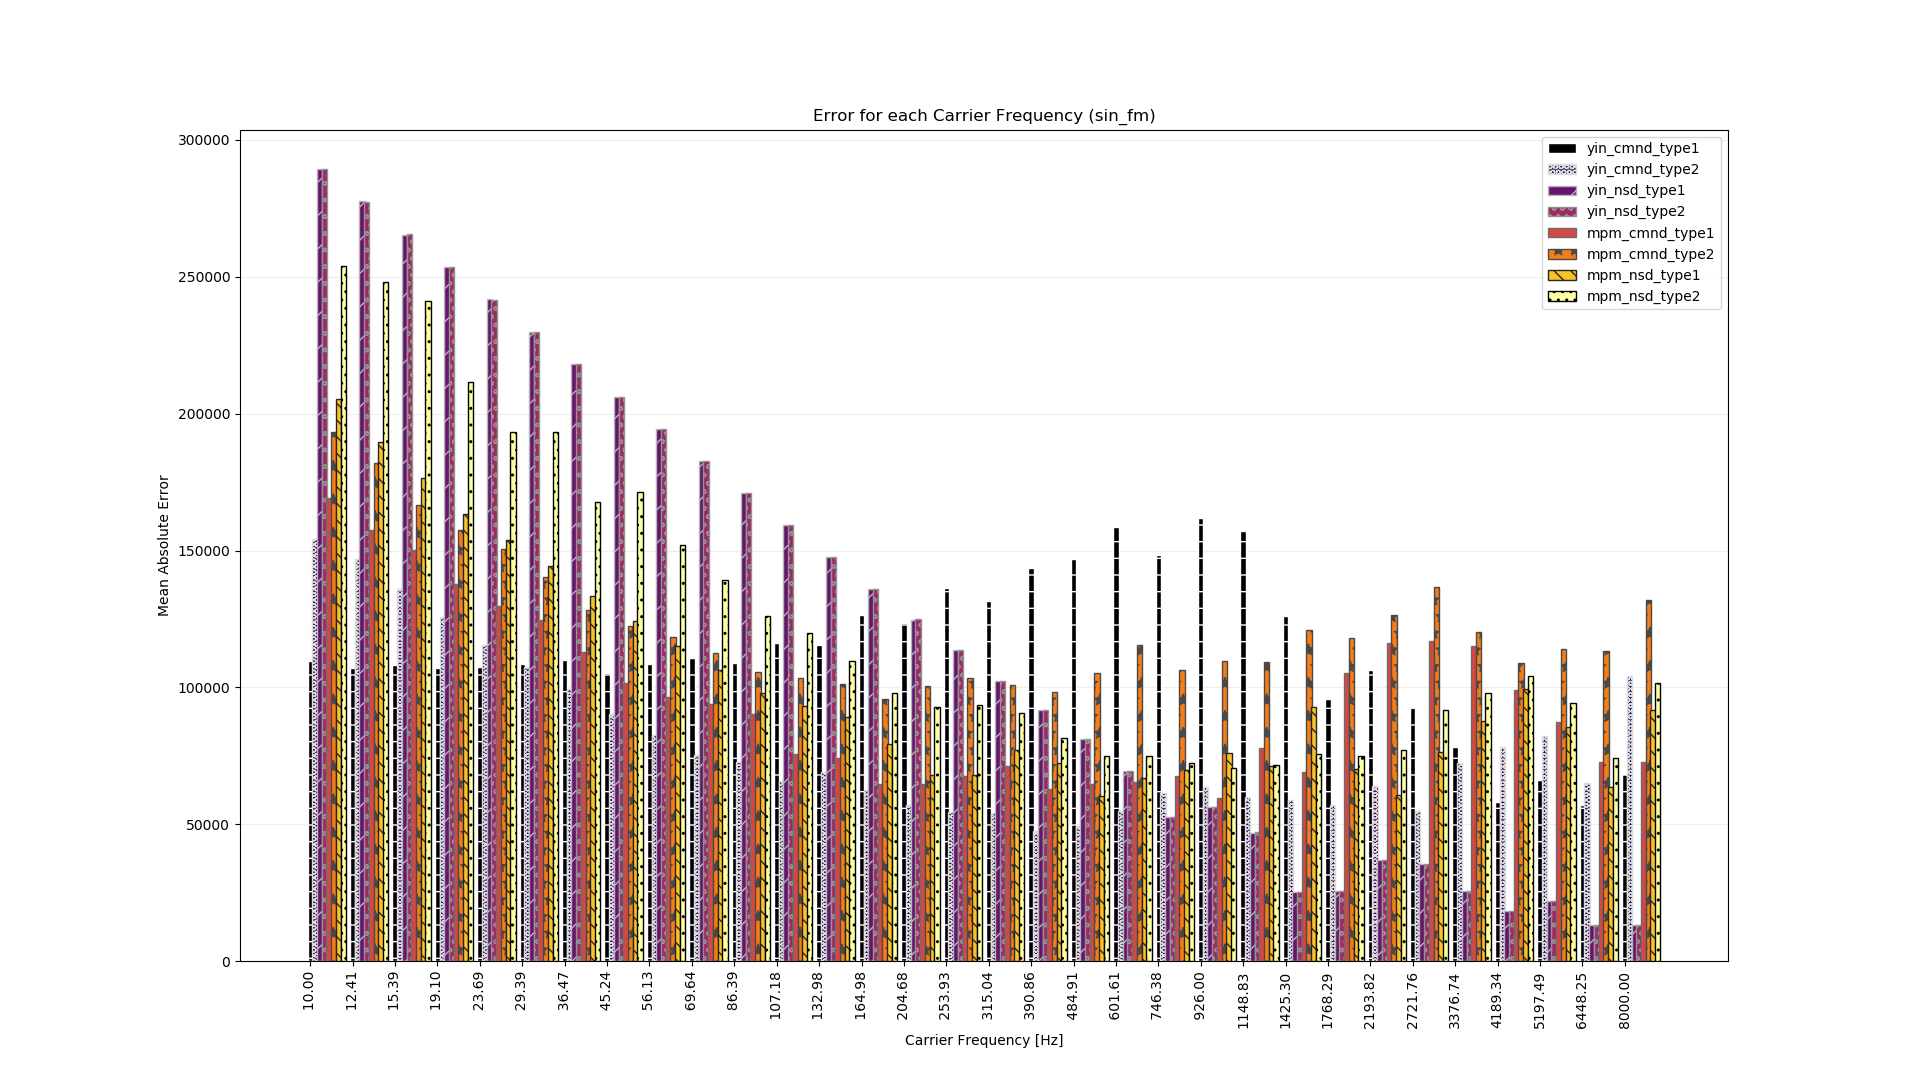
キャリアの周波数ごとの平均絶対誤差です。
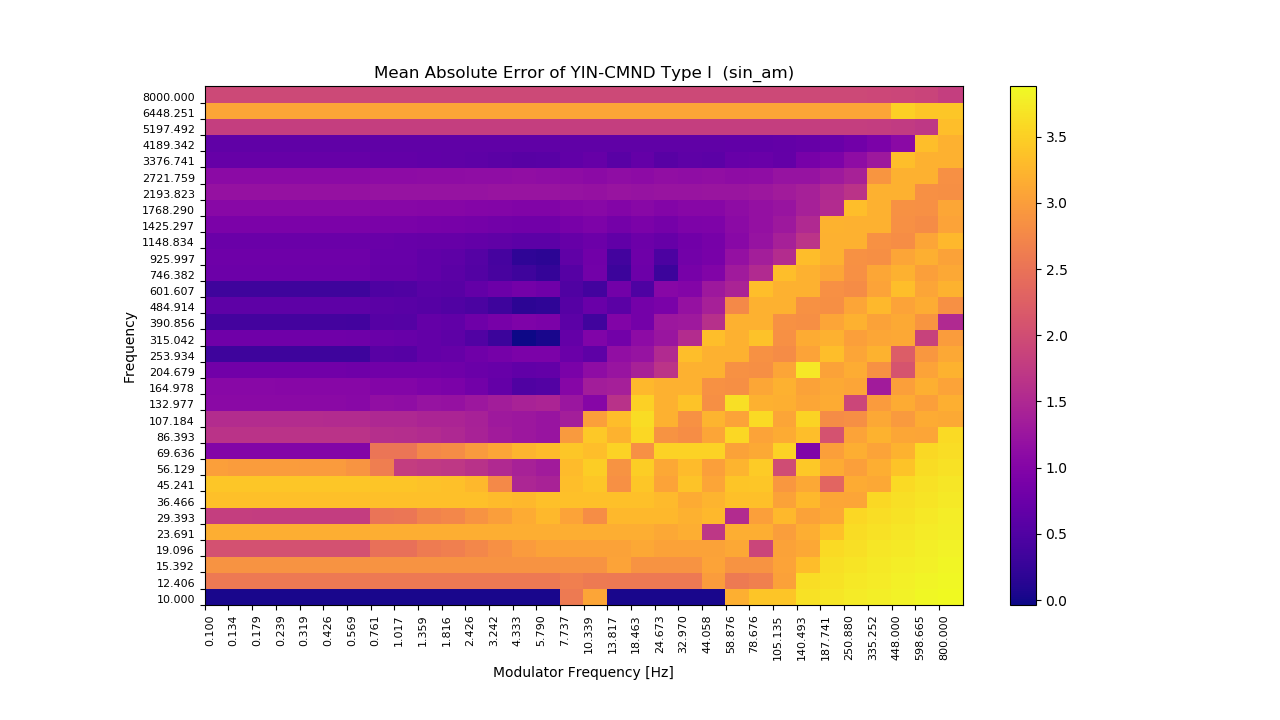
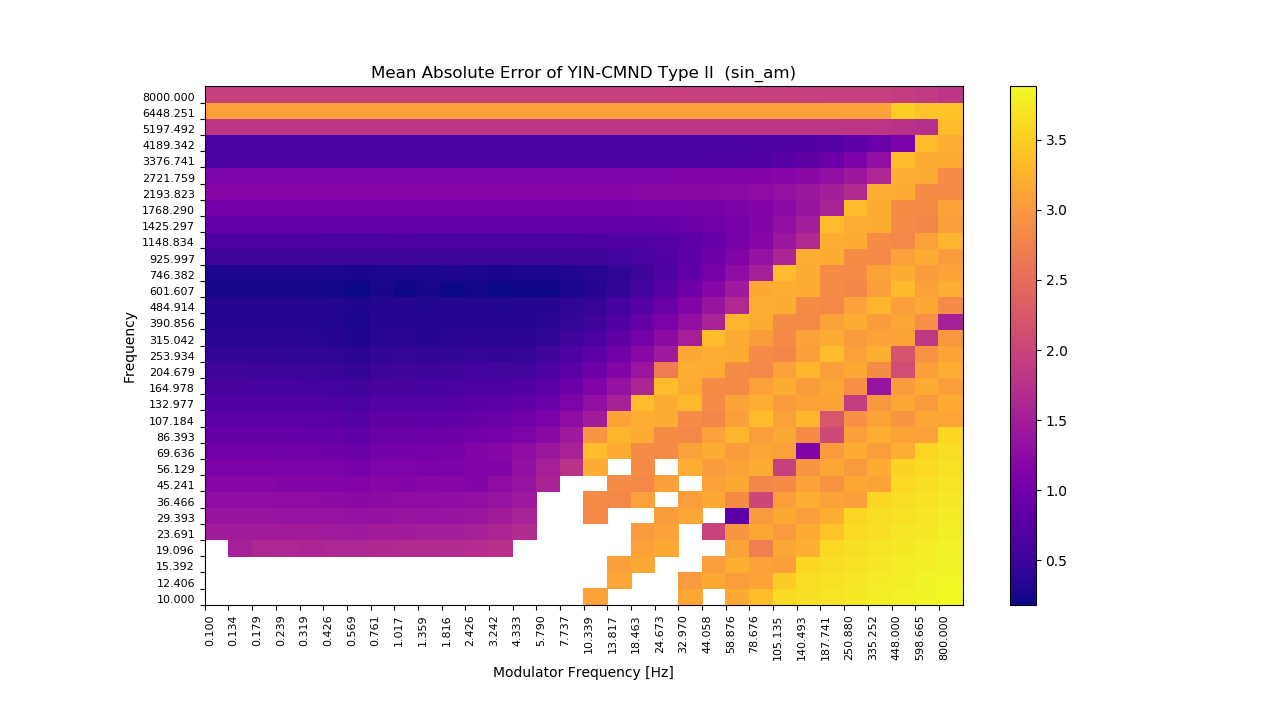
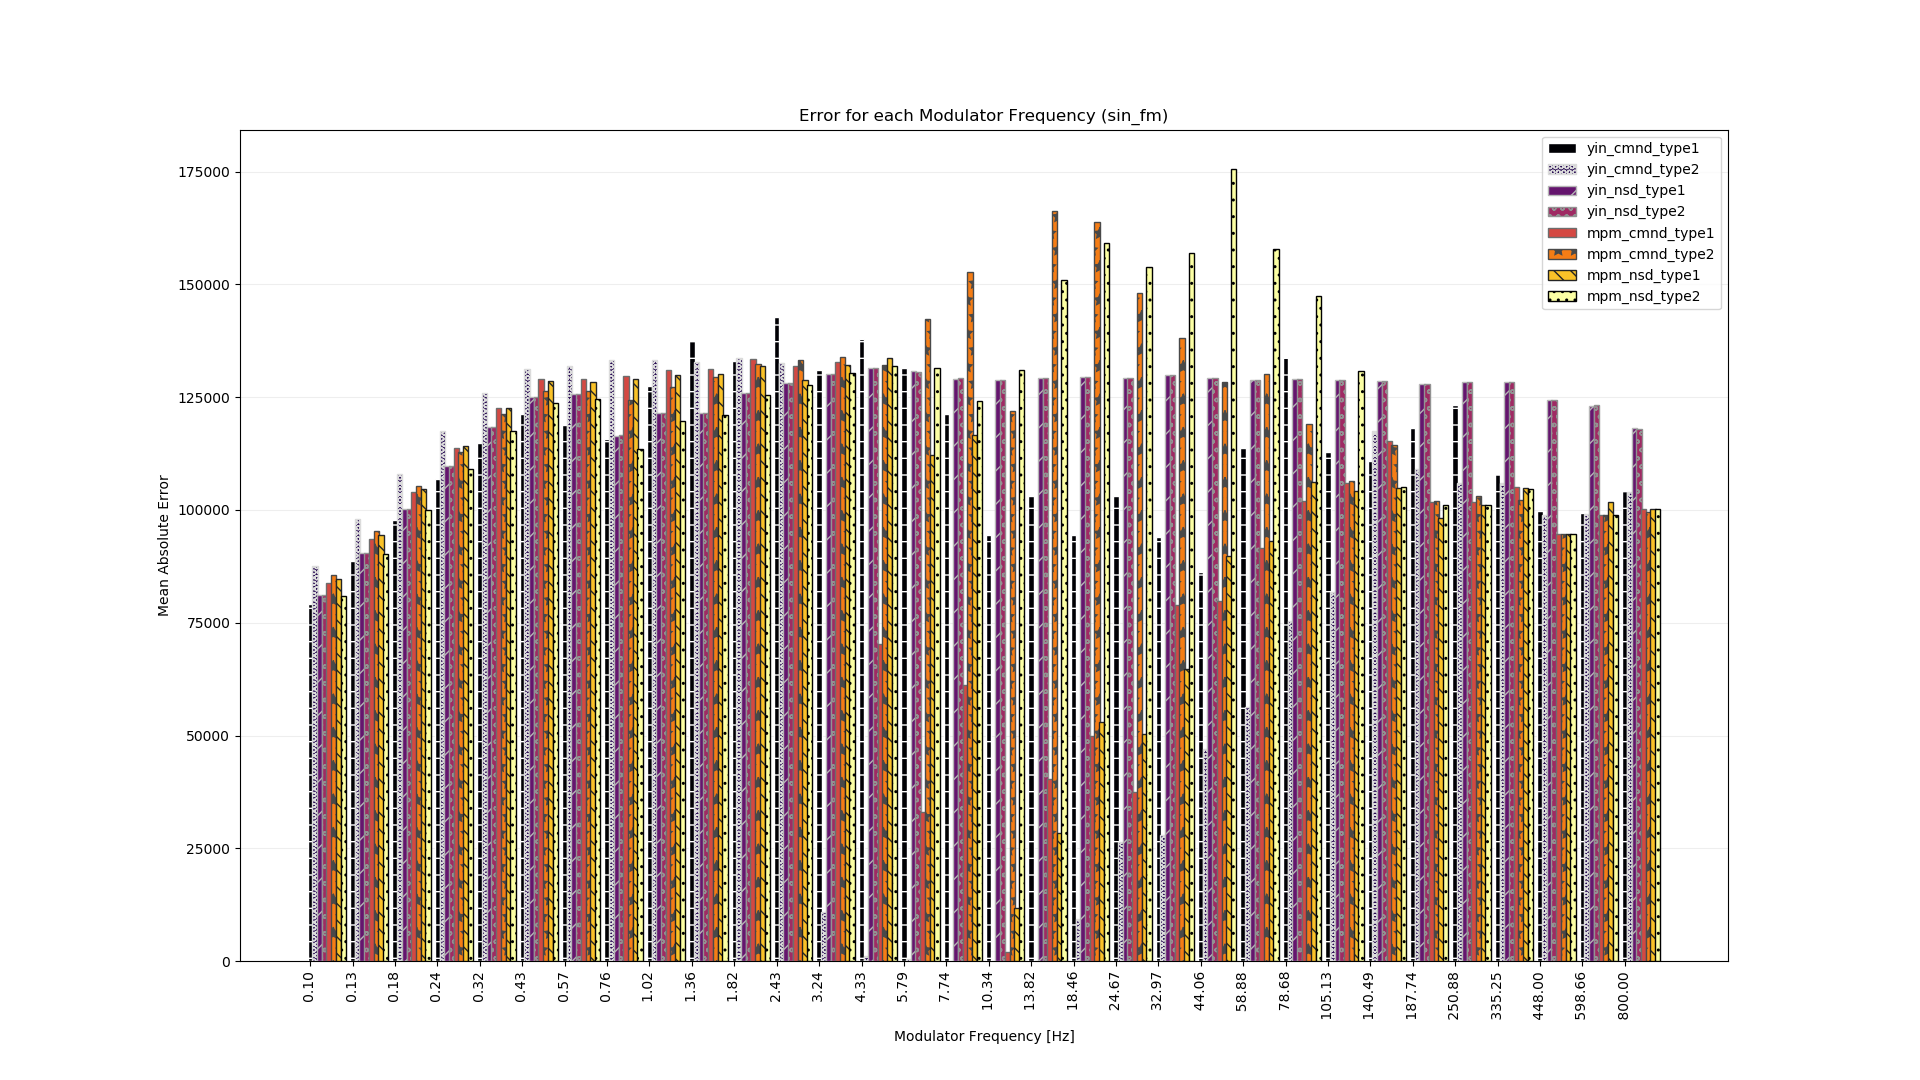
モジュレータの周波数ごとの平均絶対誤差です。
明るいほど誤差が大きく、白い部分は nan
を表しています。グラフの右にあるカラーバーの数字を \(a\) とすると誤差の値は \(10^a\) です。
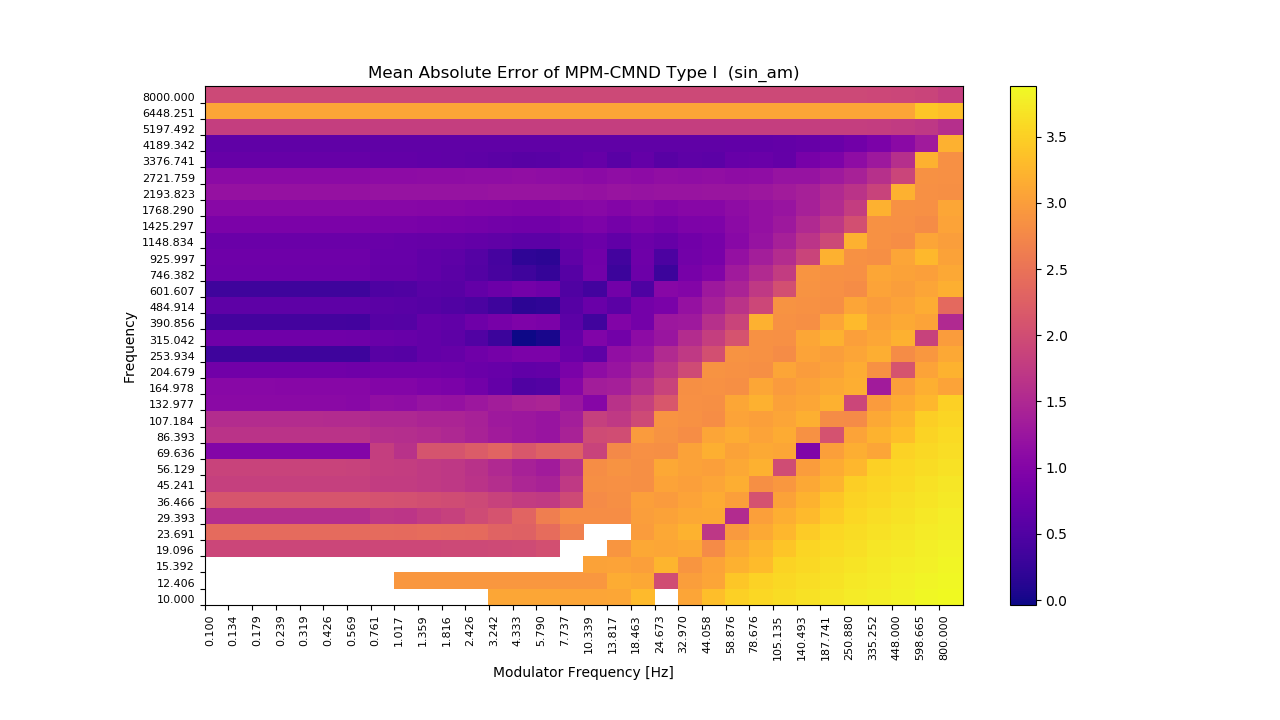
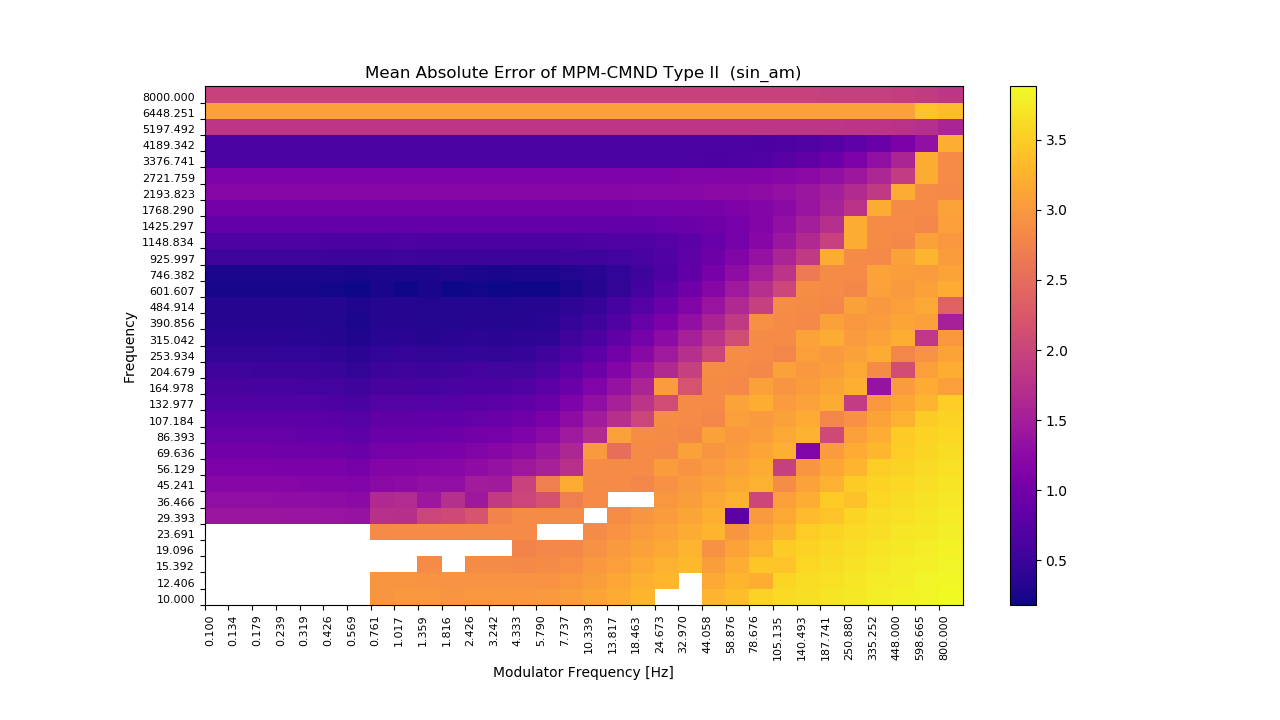
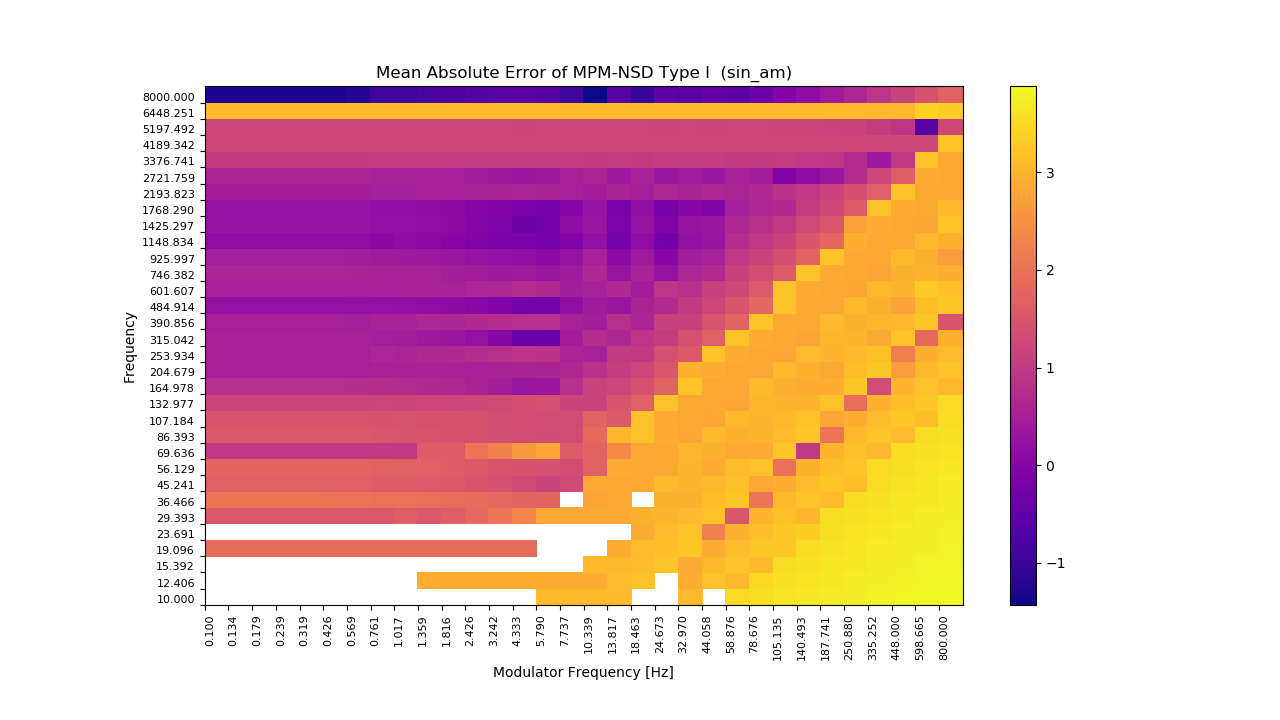
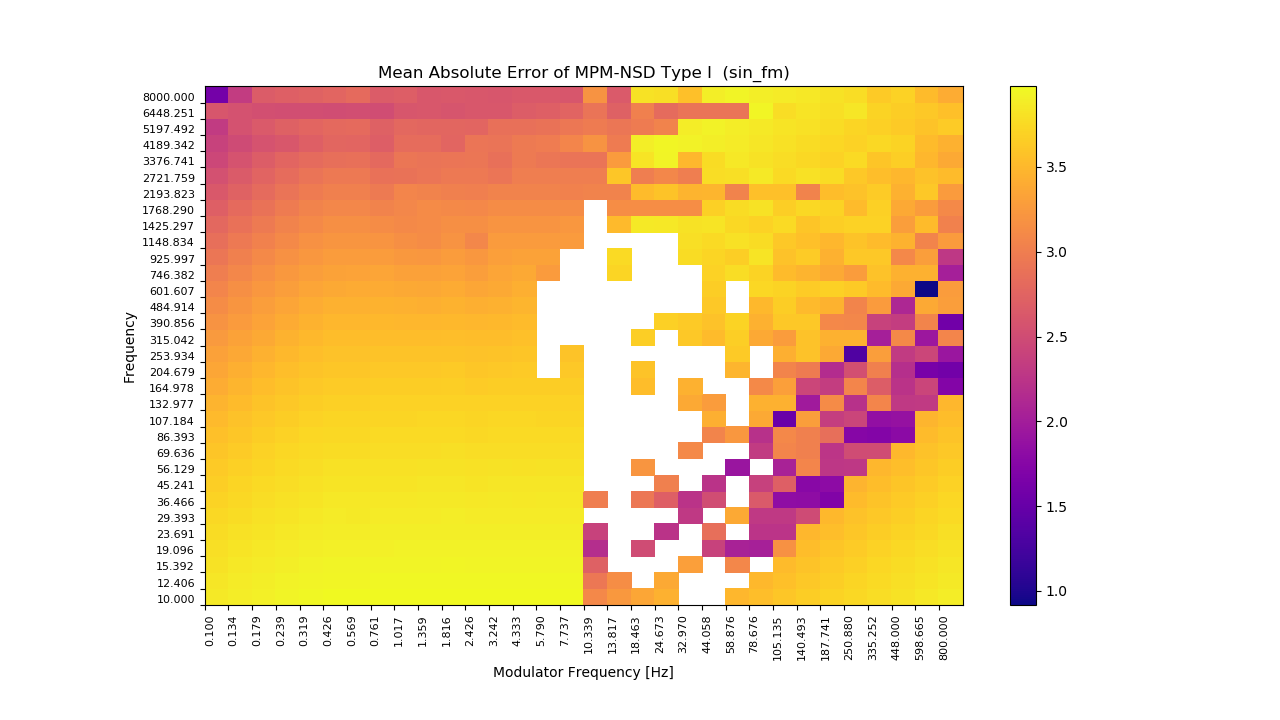
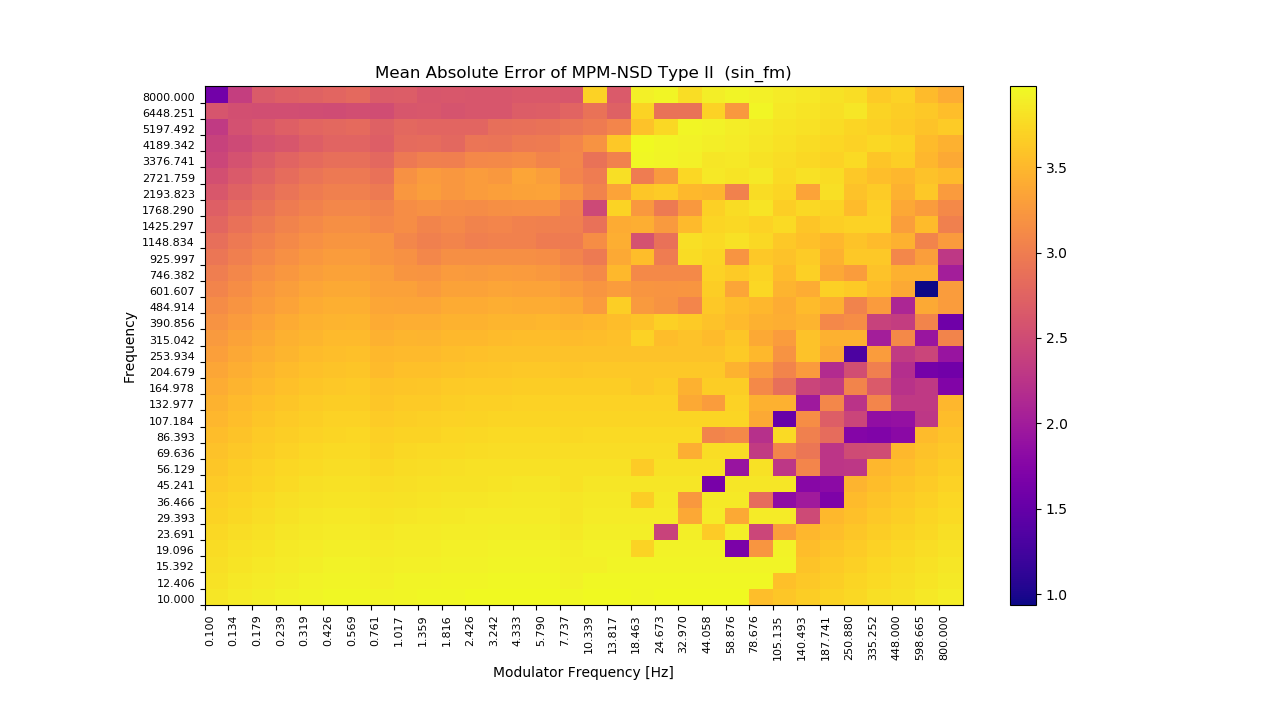
キャリアの周波数ごとの平均絶対誤差です。
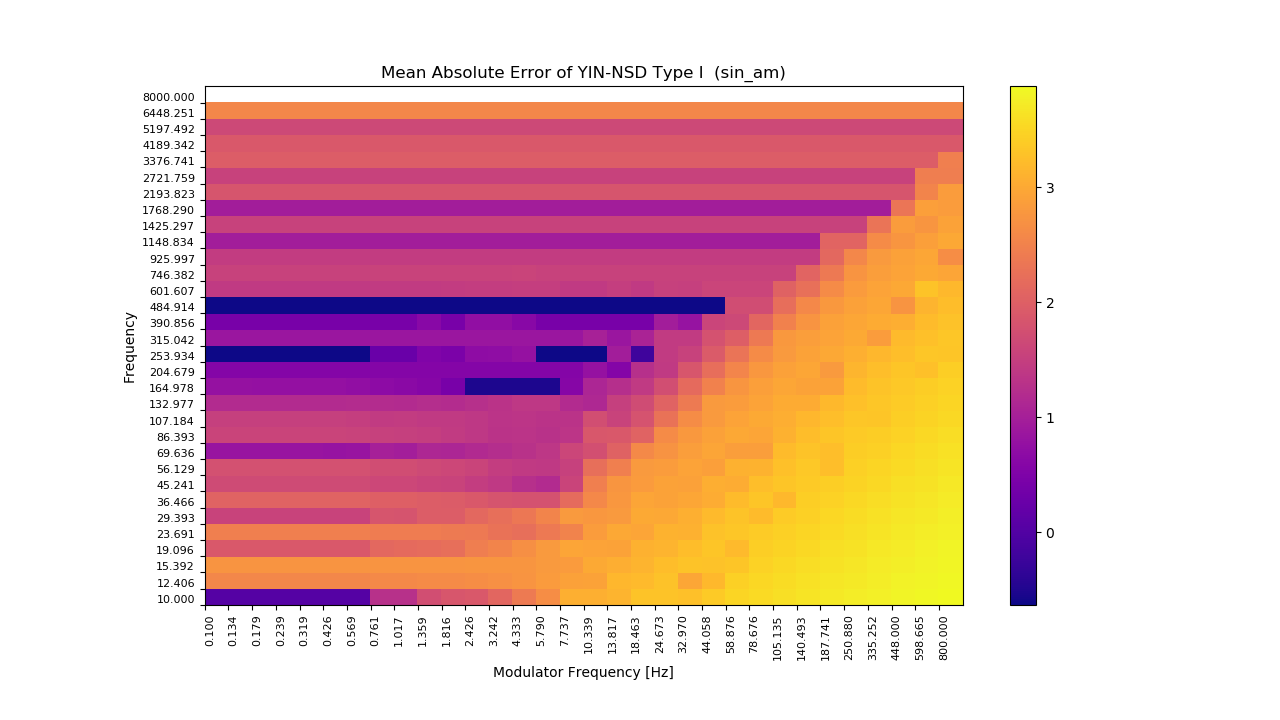
モジュレータの周波数ごとの平均絶対誤差です。
明るいほど誤差が大きく、白い部分は nan
を表しています。グラフの右にあるカラーバーの数字を \(a\) とすると誤差の値は \(10^a\) です。