何かあれば GitHub のリポジトリに issue を作るか ryukau@gmail.com までお気軽にどうぞ。


インデックスに戻る

Update: 2023-06-22

Table of Contents

プロットギャラリー

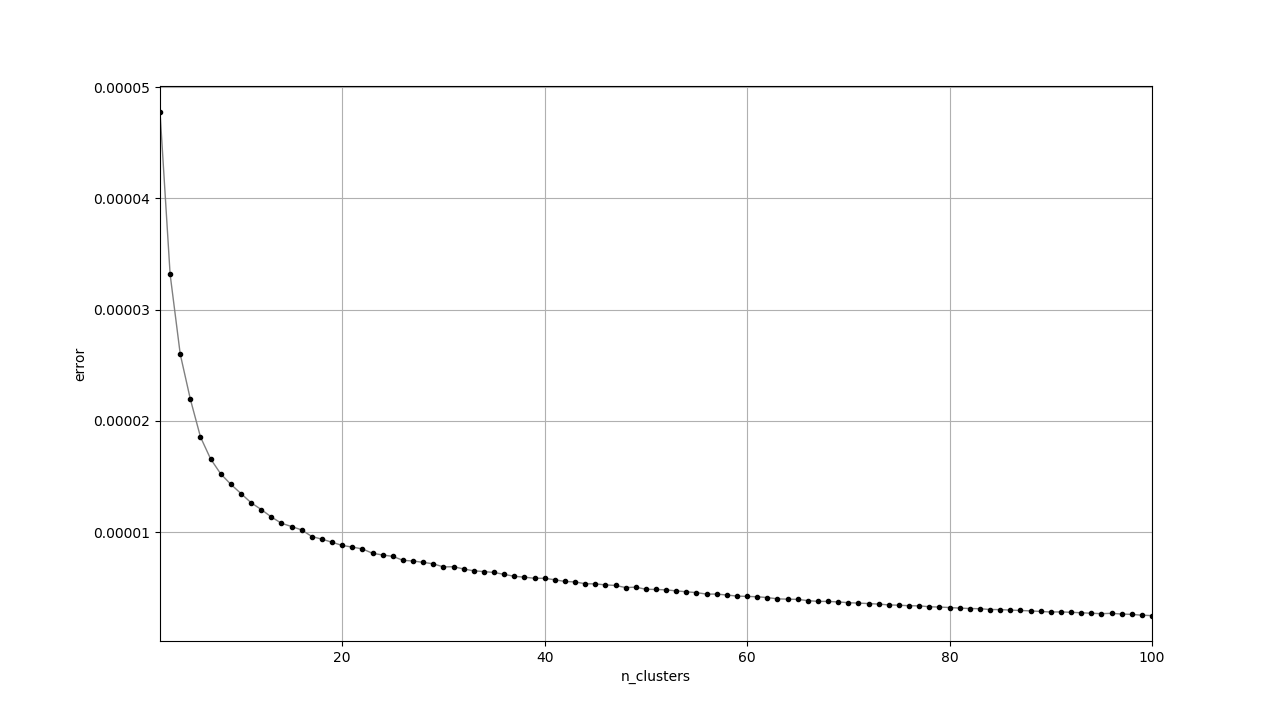
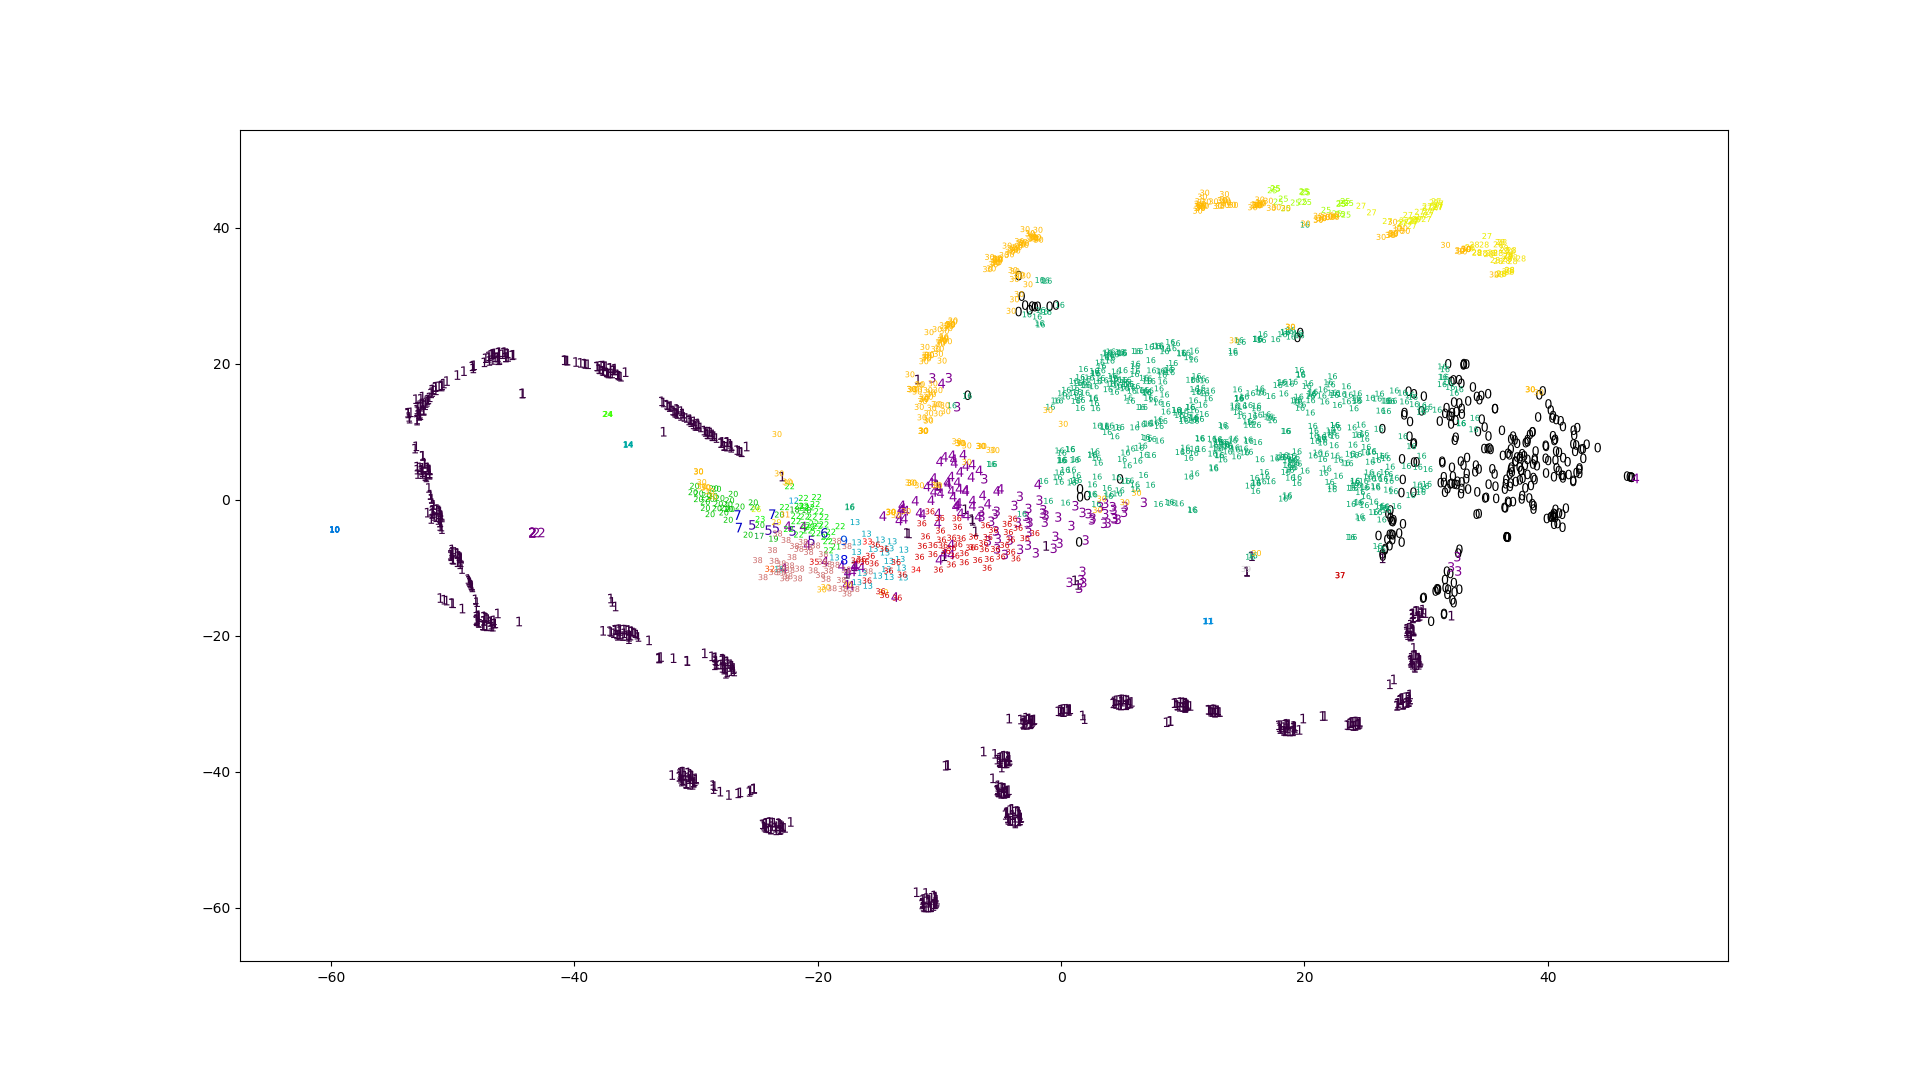
クラスタリングの特徴として試した、素朴なスペクトログラム、正規化したスペクトログラム、MFCCから得られたプロットです。

素朴なスペクトログラムは scipy.signal.spectrogram をそのまま特徴に使っています。

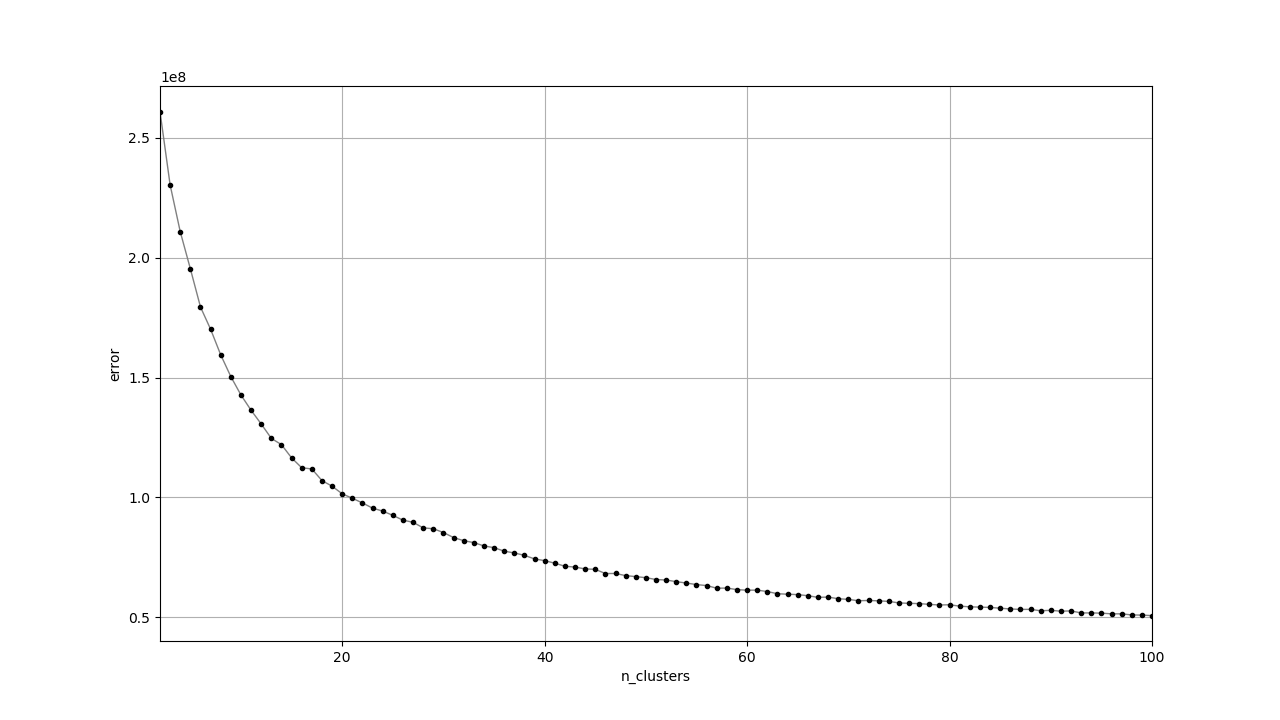
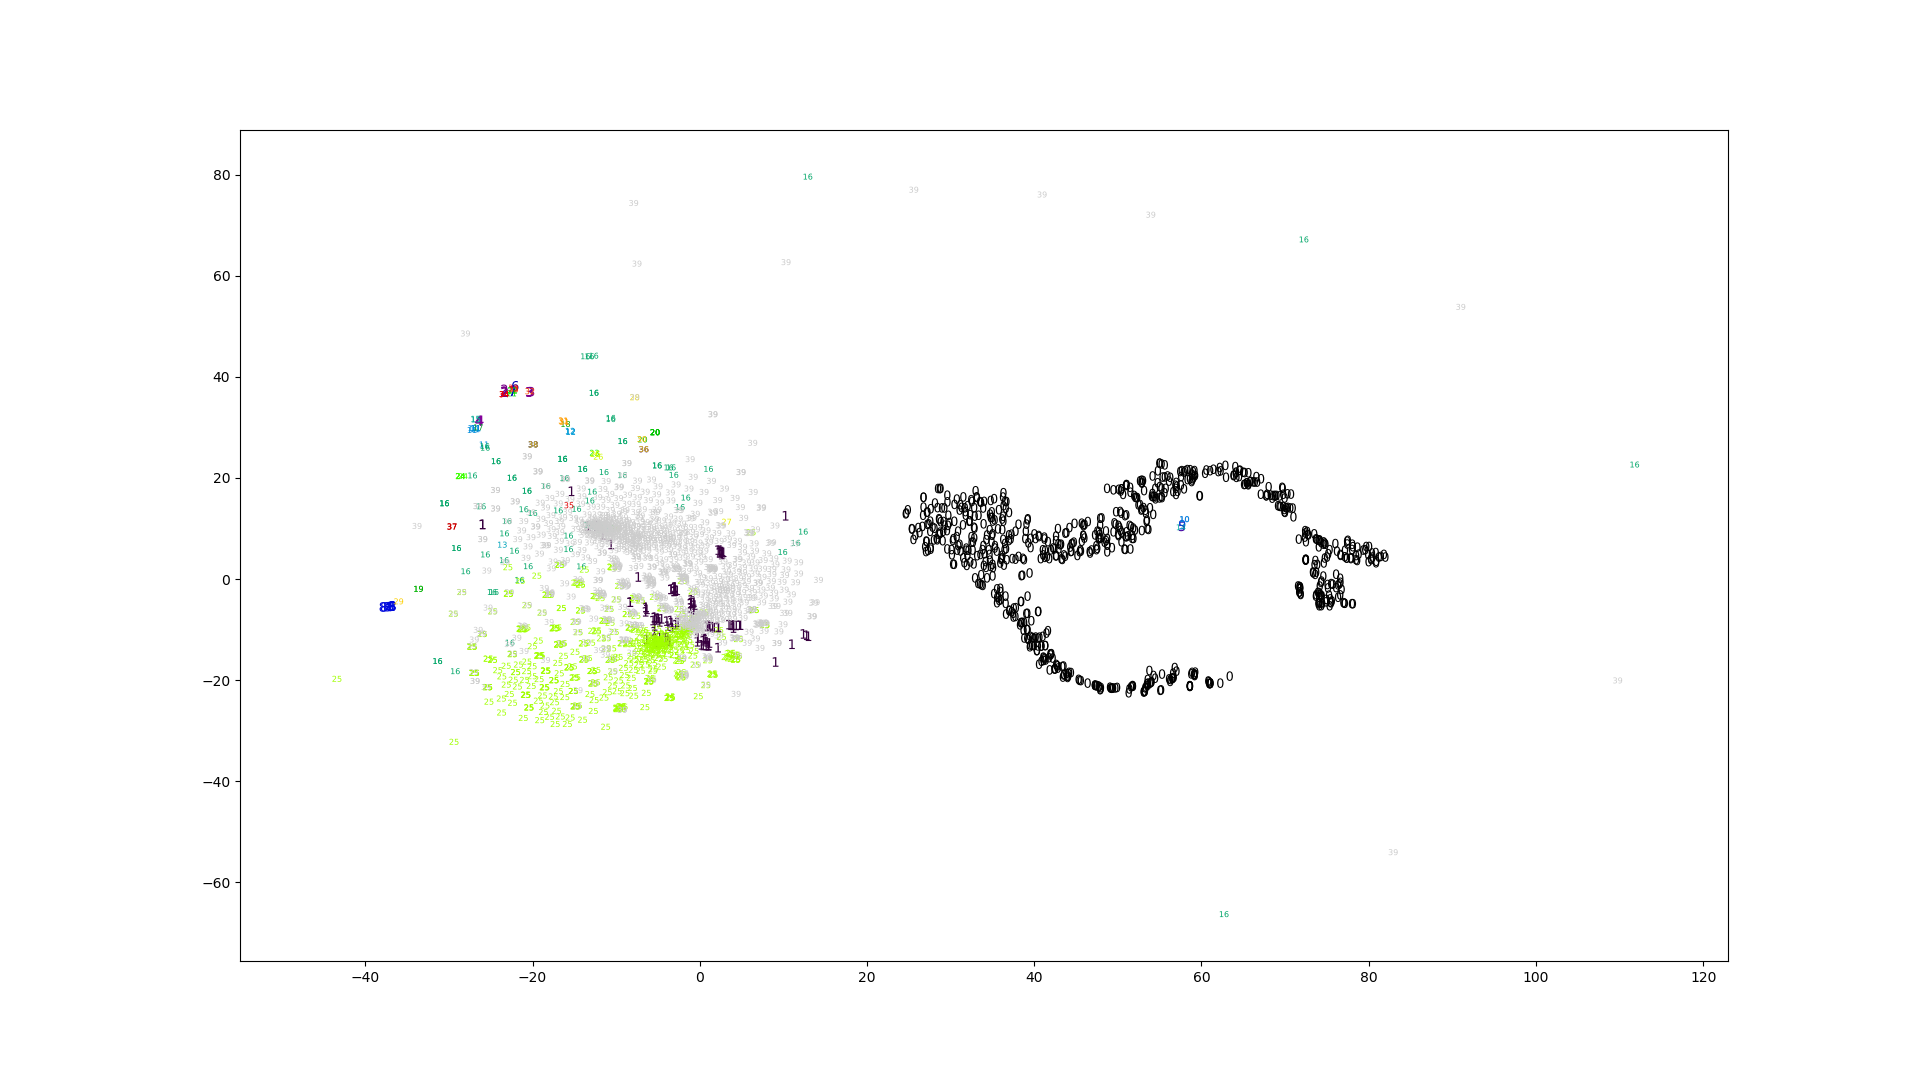
正規化したスペクトログラムはデータごとに scipy.signal.spectrogram の範囲を [0, 1] に正規化した特徴です。

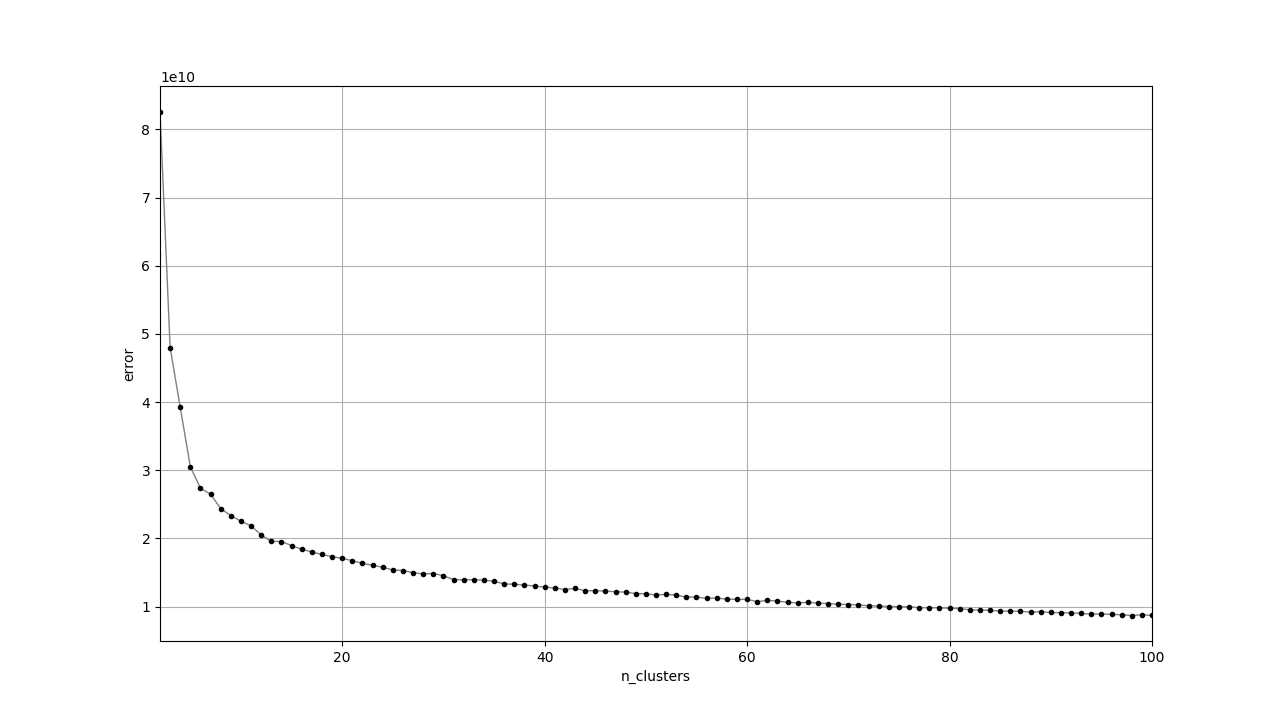
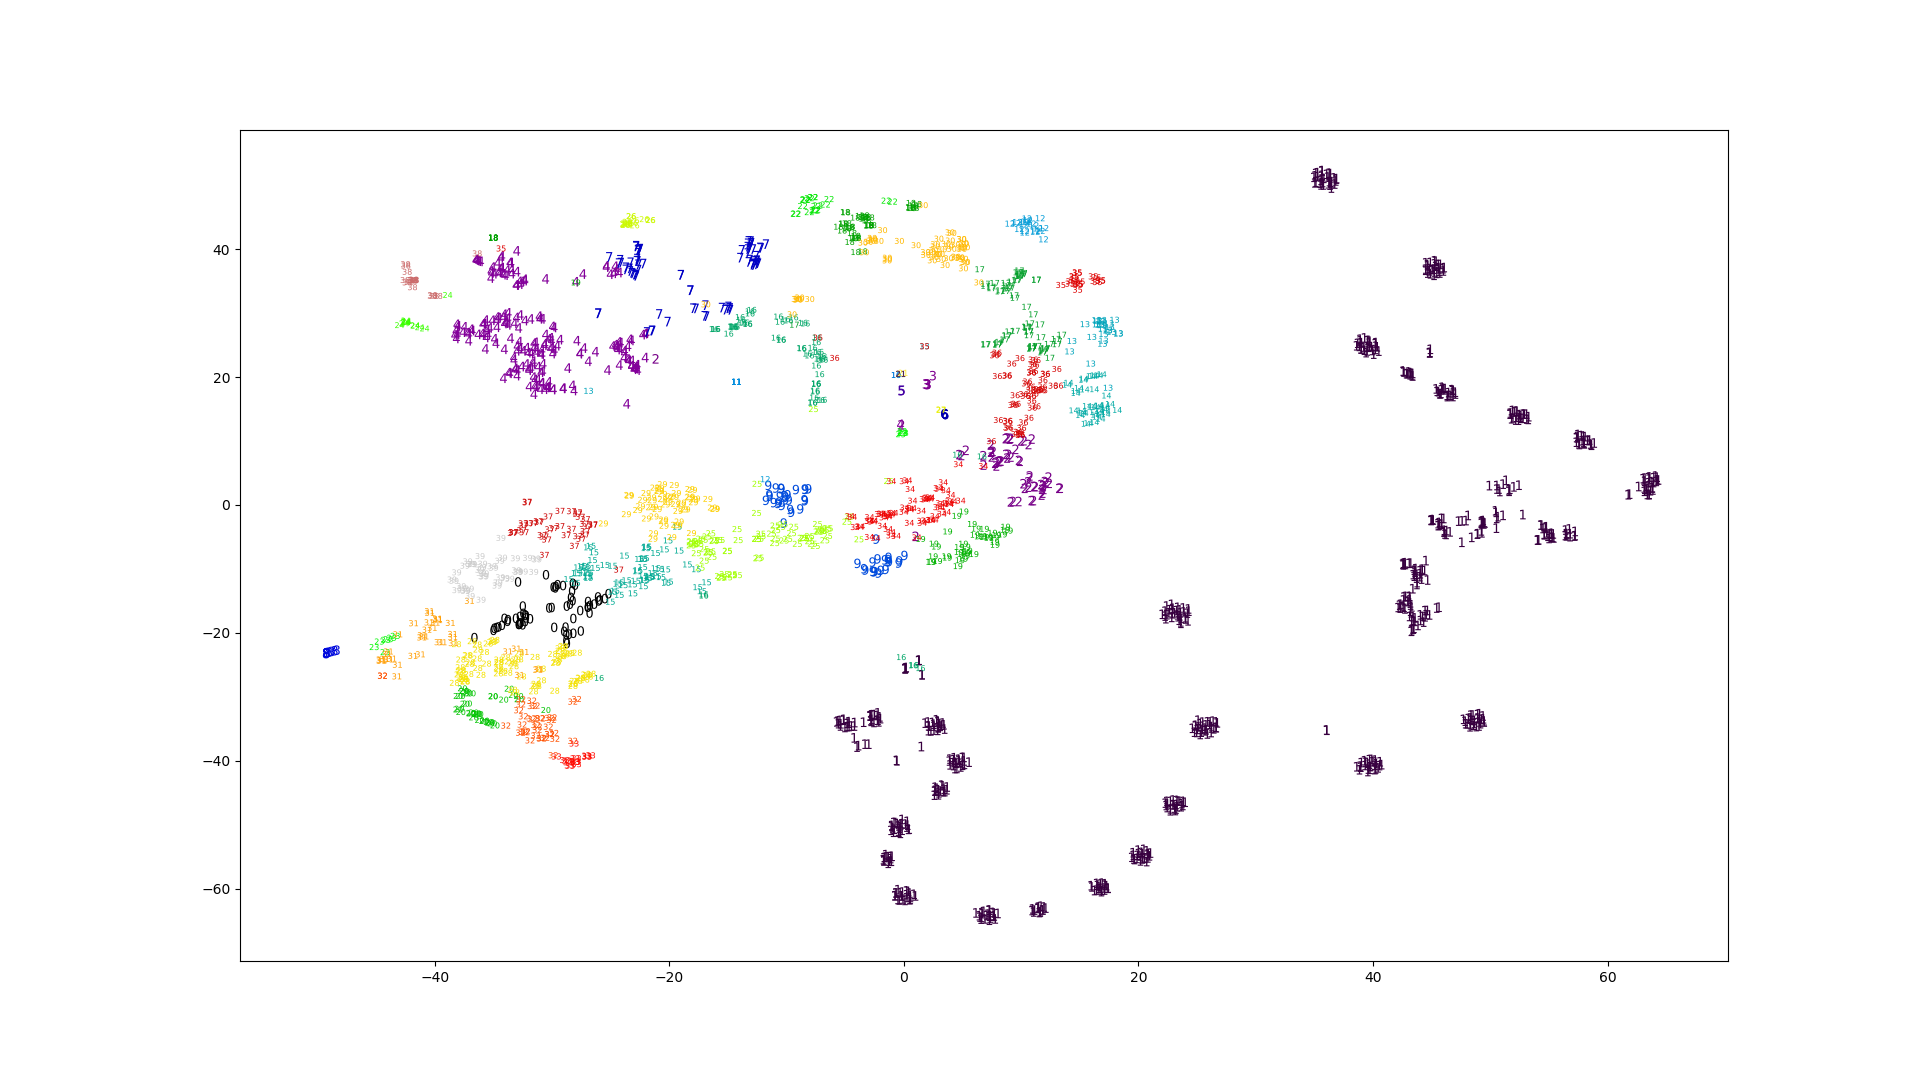
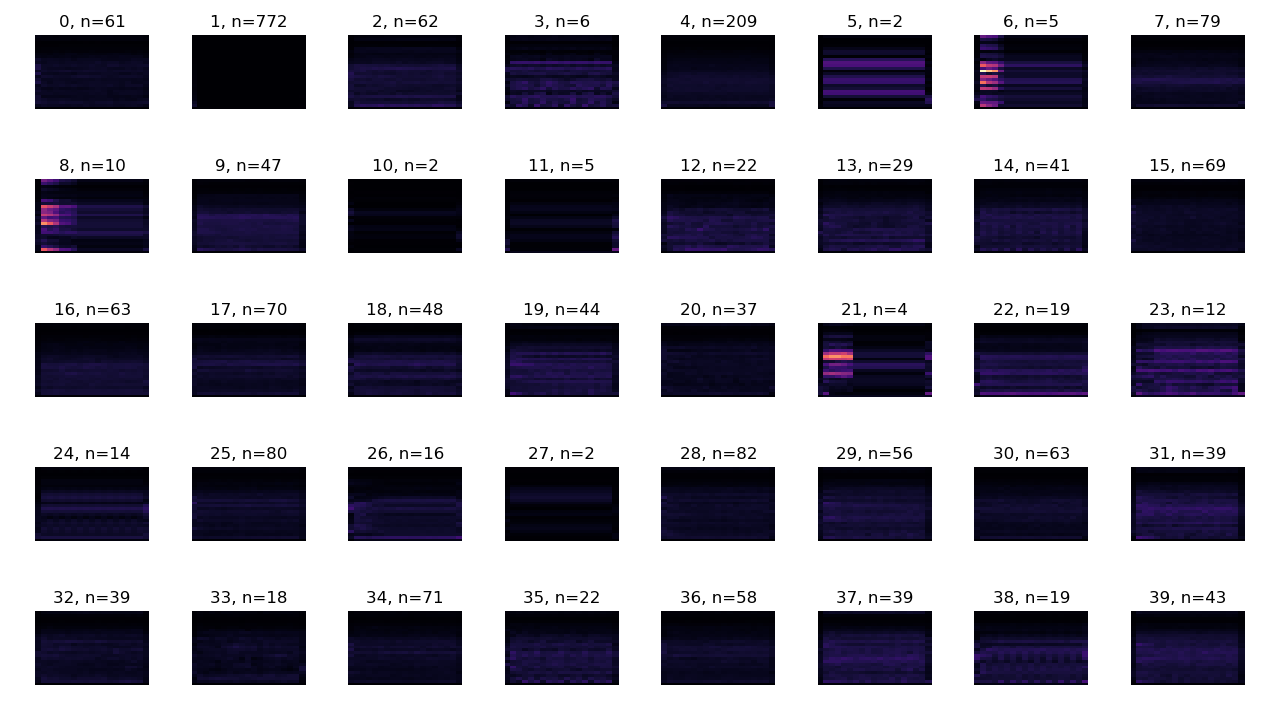
MFCCは python_speech_features.mfcc を使っています。

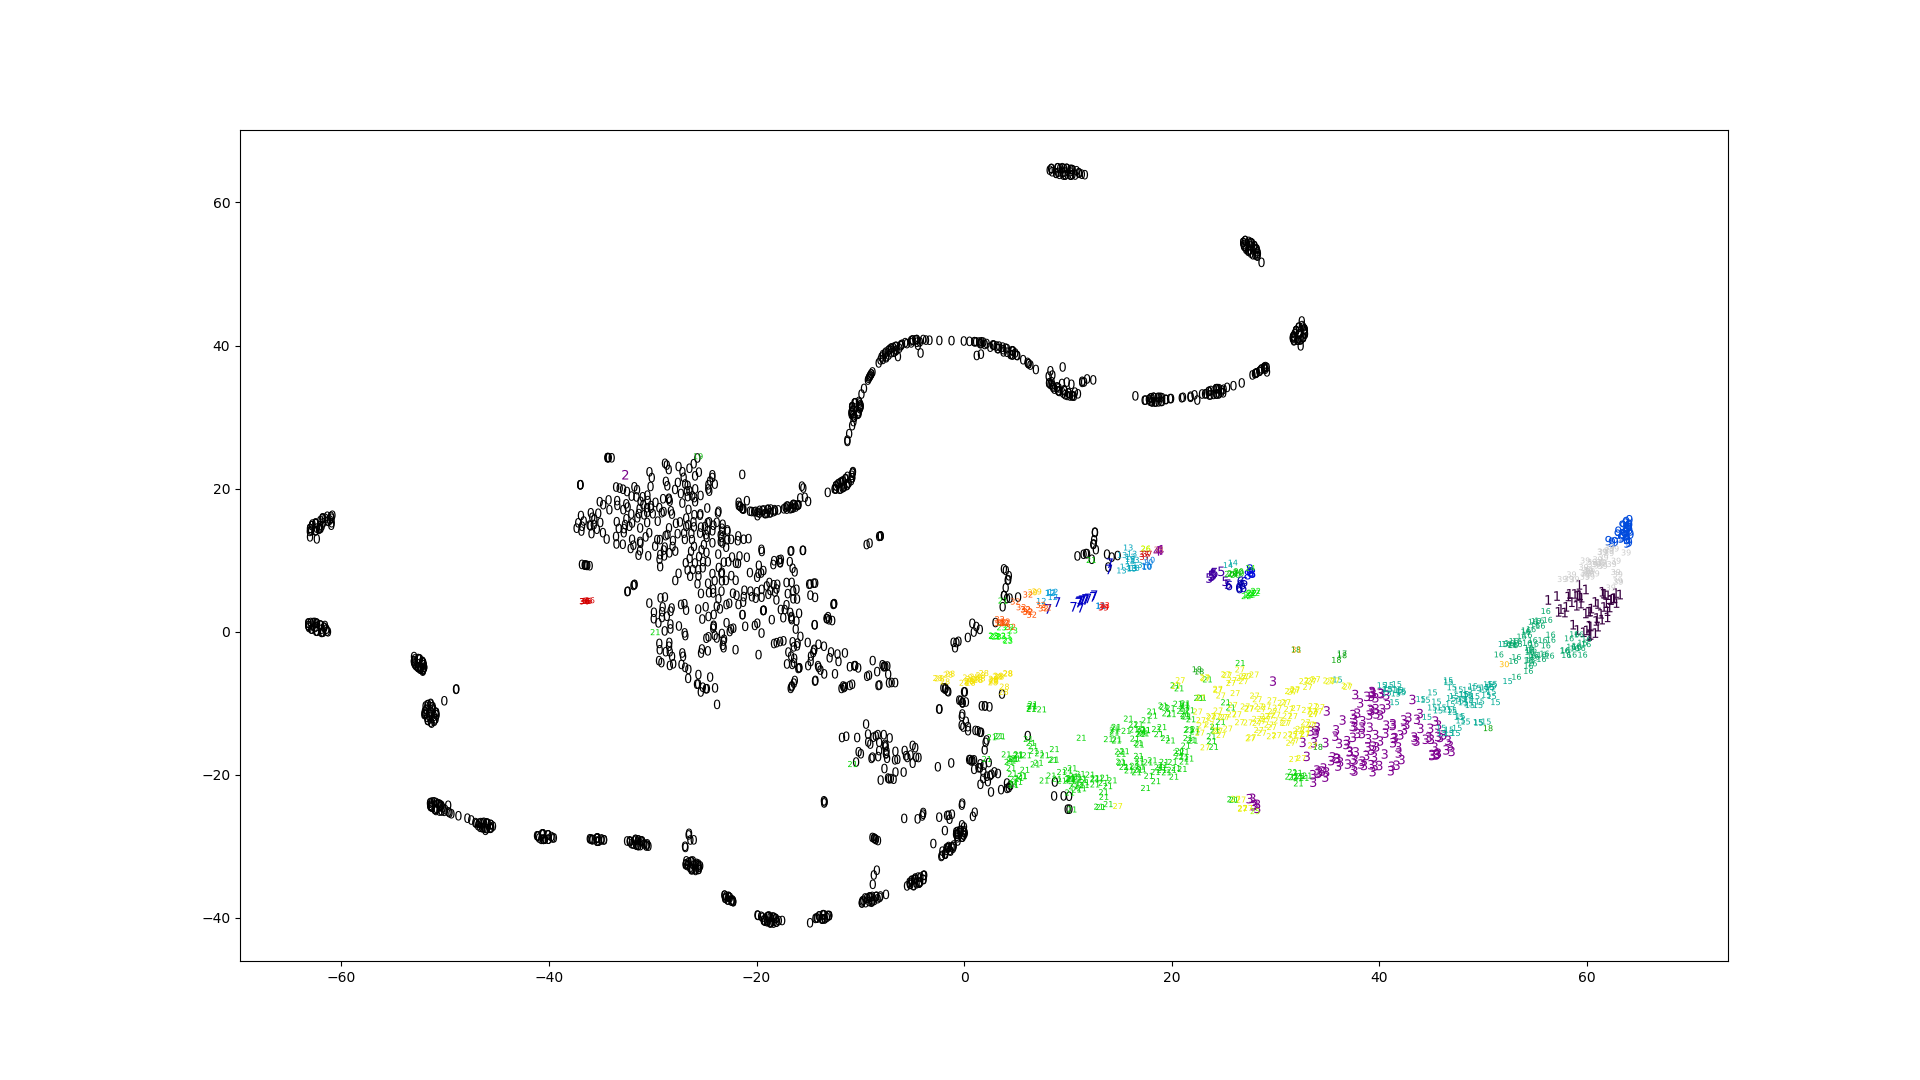
プロットは耳以外での評価が何かできないかと思ったので作りました。どれも曖昧でこれといった正解はありません。

Elbow Method

見た目はどれも似たように見えますが、素朴なスペクトログラムだけエラーの値がやたら低いです。

素朴なスペクトログラム

Image of elbow method plot from naive spectrogram features.

正規化したスペクトログラム

Image of elbow method plot from normalized spectrogram features.

対数スペクトログラム

Image of elbow method plot from log spectrogram features.

MFCC

Image of elbow method plot from mfcc features.

t-SNE

スペクトログラムから得られたクラスタはどれもいまいちな感じがします。特徴の次元が高いときは直接K-Meansに渡すよりもt-SNEで次元を減らしてからK-Meansという手法も考えられます。

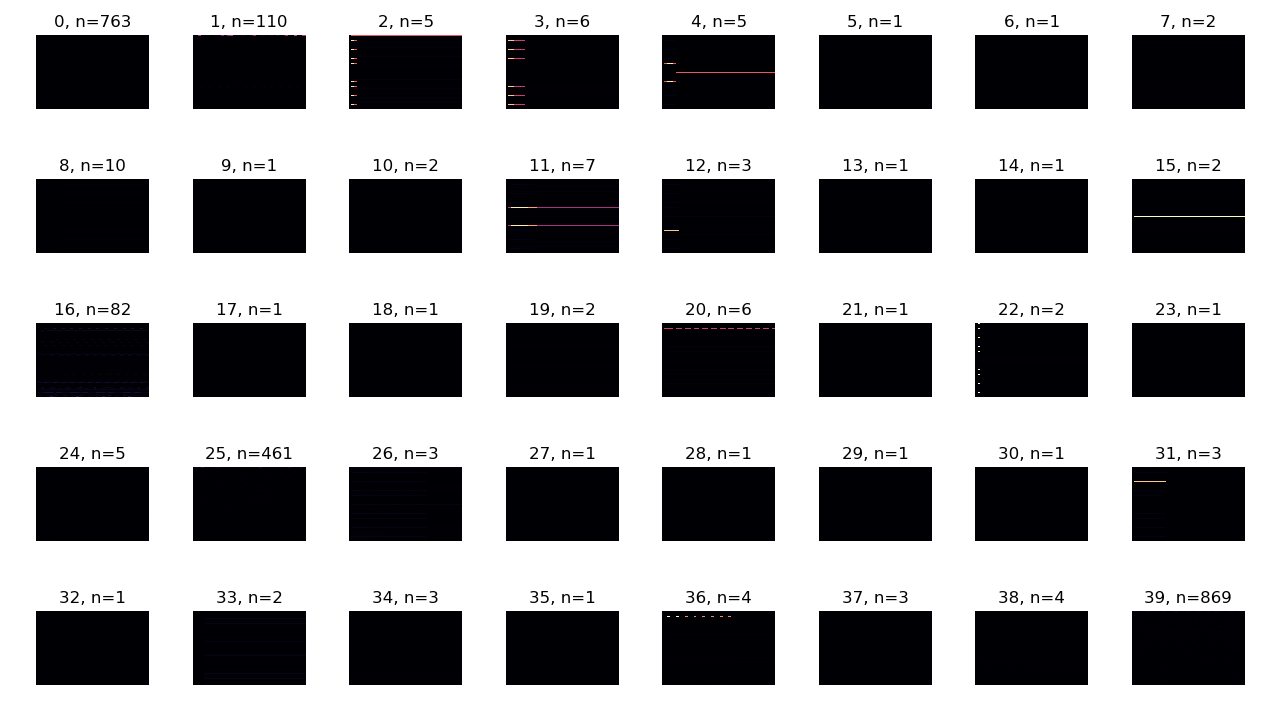
対数スペクトログラムは他と雰囲気が異なっています。

素朴なスペクトログラム

Image of t-SNE plot from naive spectrogram features.

正規化したスペクトログラム

Image of t-SNE plot from normalized spectrogram features.

対数スペクトログラム

Image of t-SNE plot from log spectrogram features.

MFCC

Image of t-SNE plot from mfcc features.

中央値

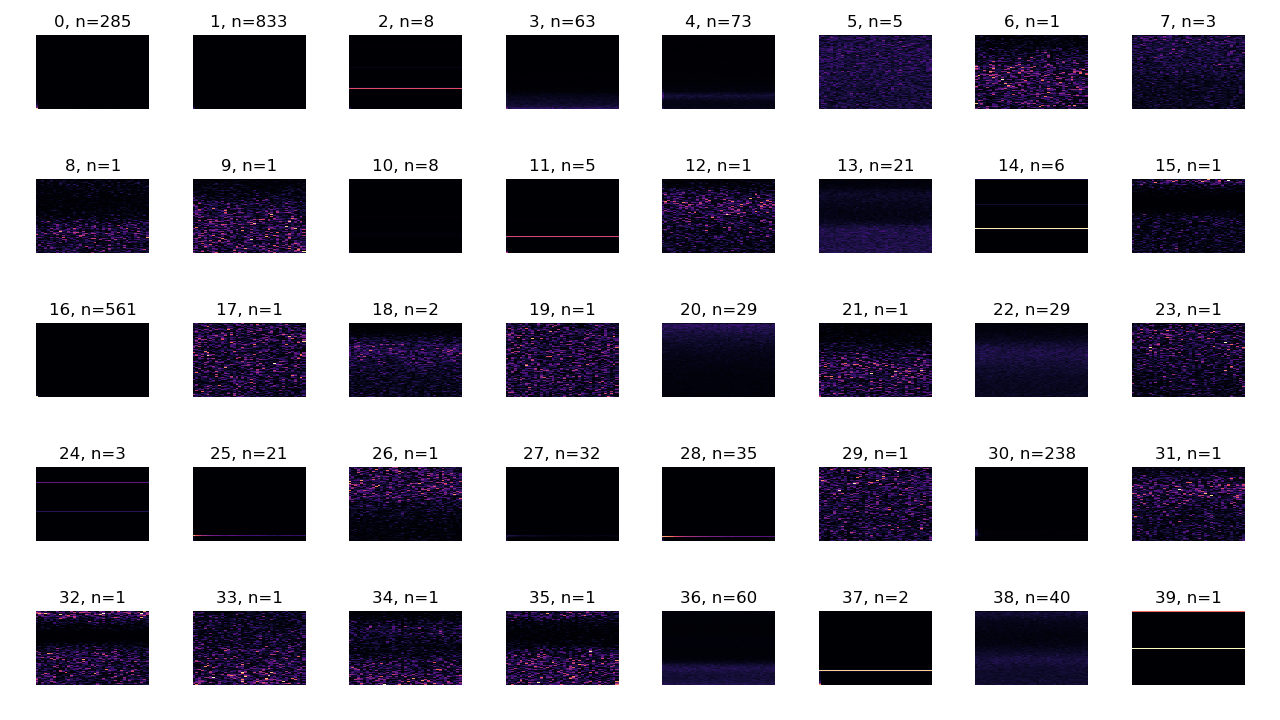
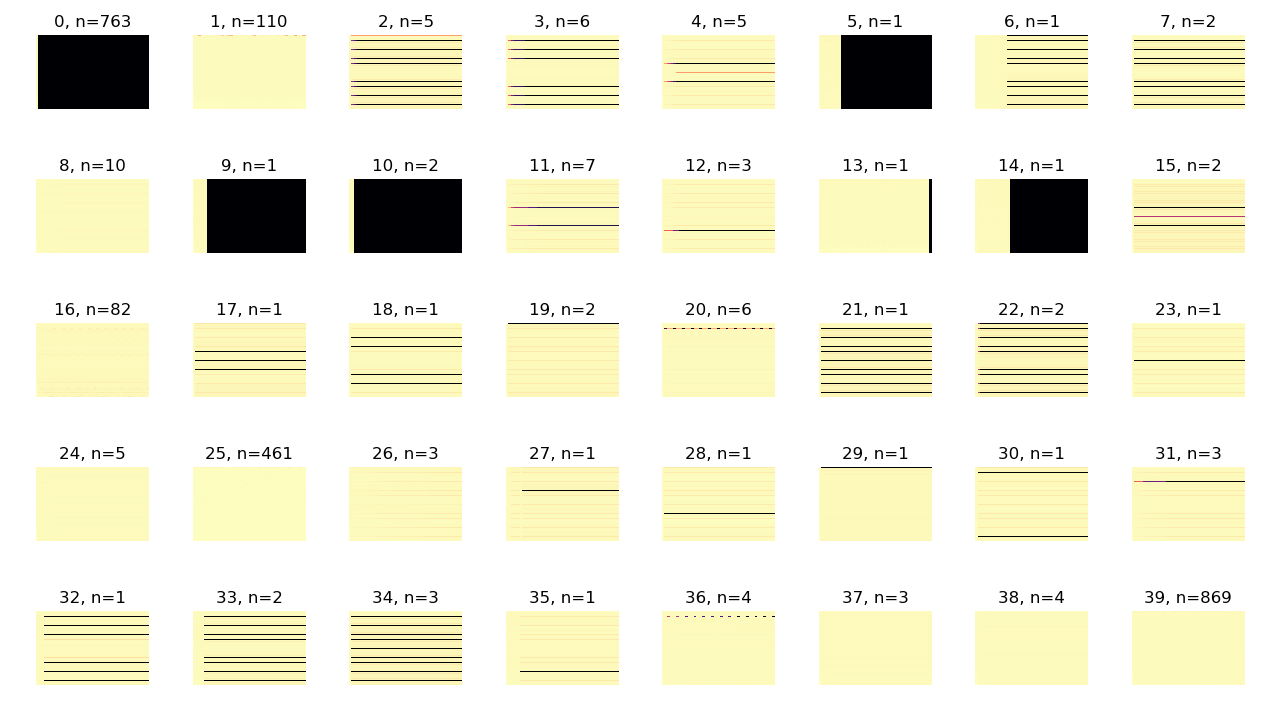
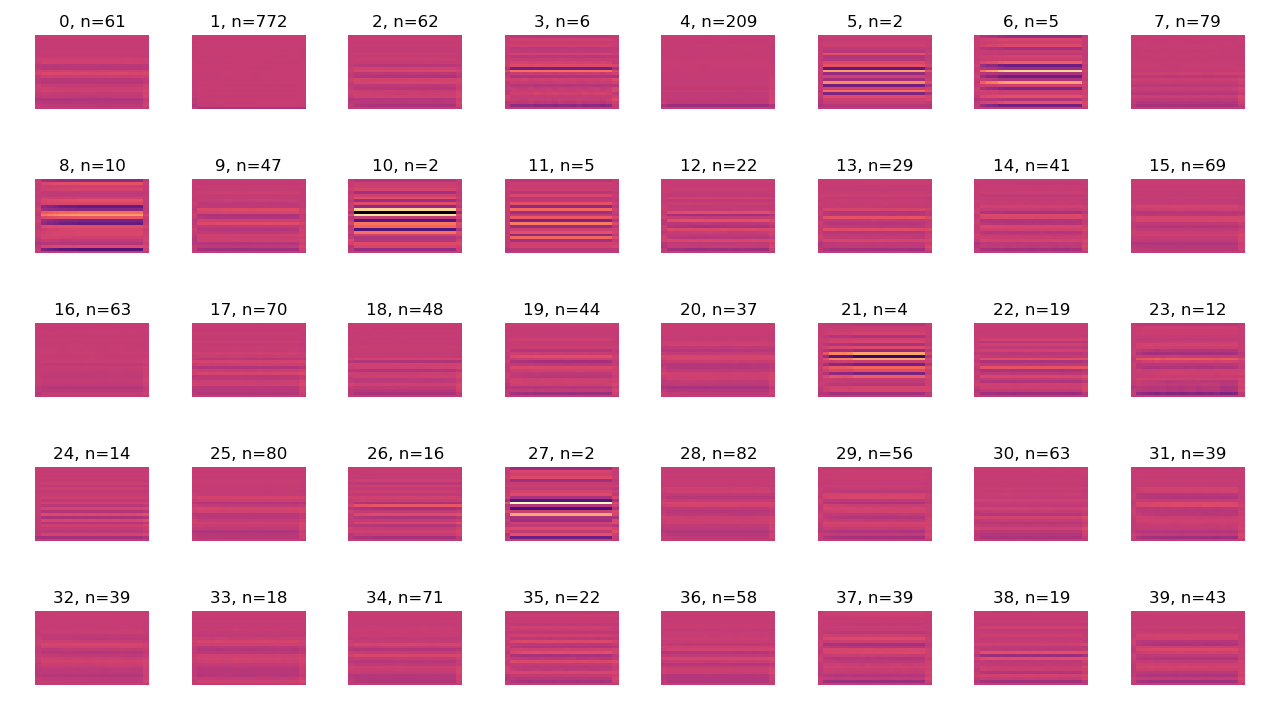
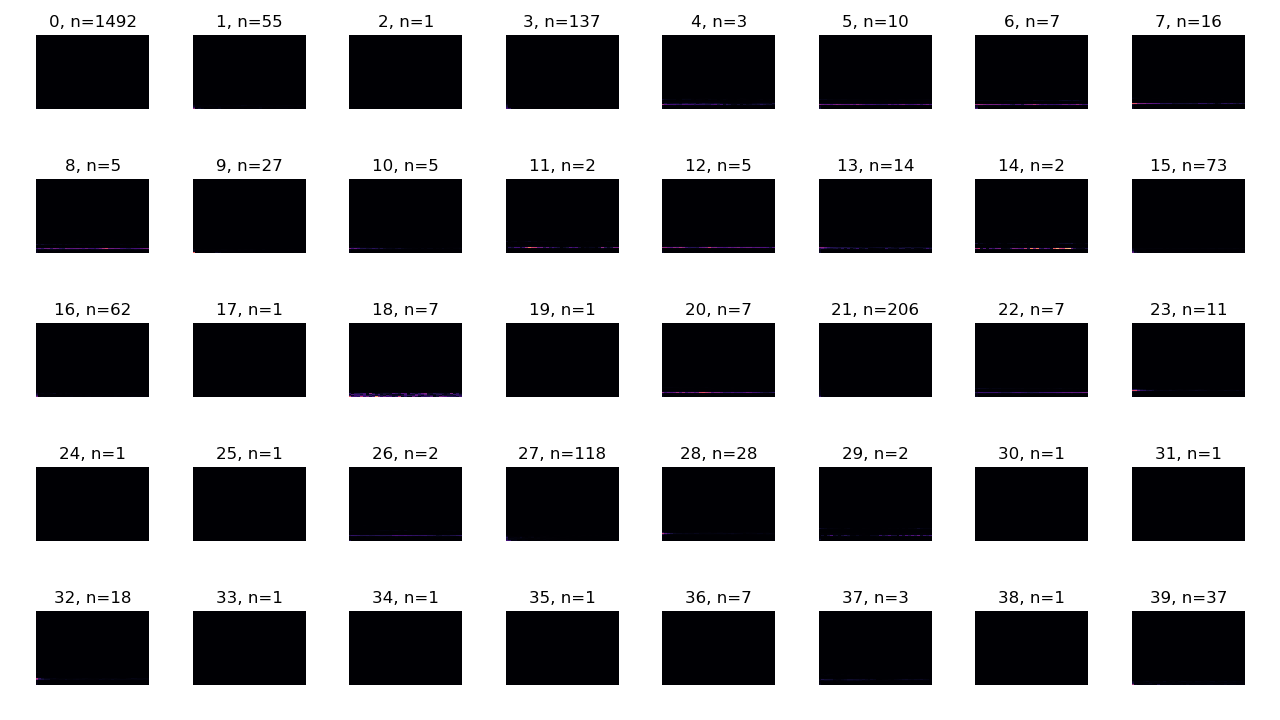
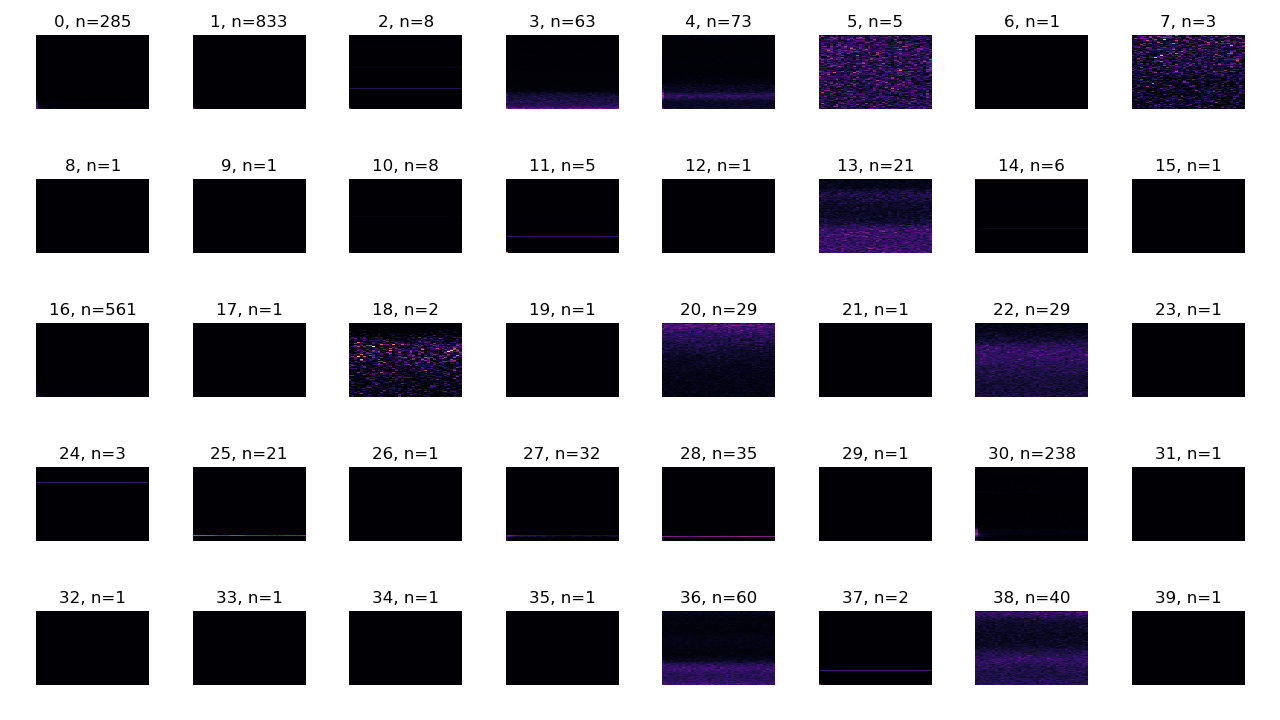
中央値が表すスペクトログラムとMFCCです。各画像の縦が周波数で下から上に向かって大きくなります。横は時間で左から右に向かって進んでいます。明るい部分ほど係数が大きくなります。 n はクラスタに含まれるデータポイントの数を表しています。

スペクトログラムによるクラスタはどれも n=1 となる outlier がMFCCに比べると多いです。3つの内では正規化したスペクトログラムが一番良さそうに見えます。対数スペクトログラムは極端な値が出ているように見えます。素朴なスペクトログラムが真っ黒なのは一部の値が極端に大きいからです。

素朴なスペクトログラム

Image of plot of K-Means centers from naive spectrogram features.

正規化したスペクトログラム

Image of plot of K-Means centers from normalized spectrogram features.

対数スペクトログラム

Image of plot of K-Means centers from log spectrogram features.

MFCC

Image of plot of K-Means centers from mfcc features.

平均絶対誤差 (Mean Absolute Error)

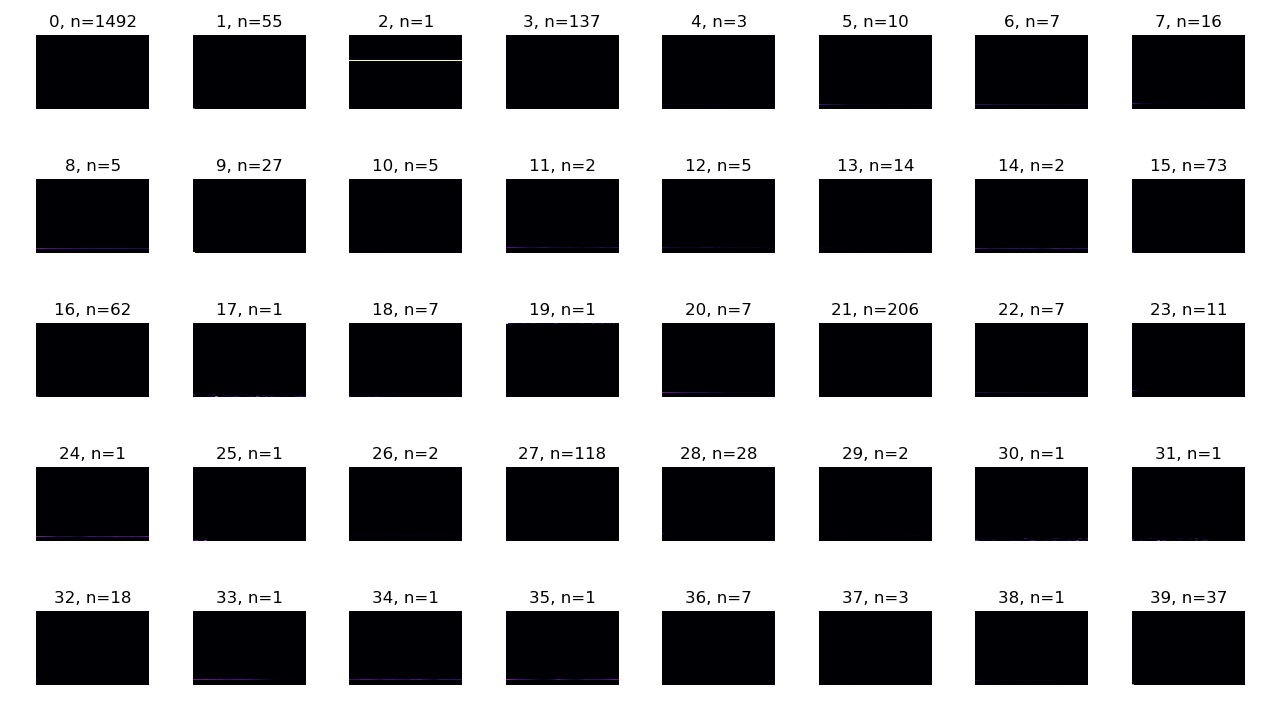
中央値と、中央値が代表するクラスタ内のデータポイントとの平均絶対誤差です。

素朴なスペクトログラム

Image of plot of mean absolute errors between K-Means centers and corresponding data points from naive spectrogram.

正規化したスペクトログラム

Image of plot of mean absolute errors between K-Means centers and corresponding data points from normalized spectrogram.

対数スペクトログラム

Image of plot of mean absolute errors between K-Means centers and corresponding data points from log spectrogram.

MFCC

Image of plot of mean absolute errors between K-Means centers and corresponding data points from MFCC.

耳で聞いた印象

素朴なスペクトログラム

n<=20 のクラスタは似たような音が入っている。 n が大きいクラスタは何でもあり。

正規化したスペクトログラム

対数スペクトログラム

MFCC